Activity 4 - Basic GA4 metrics and dimensions
Before you start building reports, comparisons, or explorations in GA4, you must clearly understand two fundamental building blocks of analytics:
-
Dimensions → describe data
-
Metrics → measure data
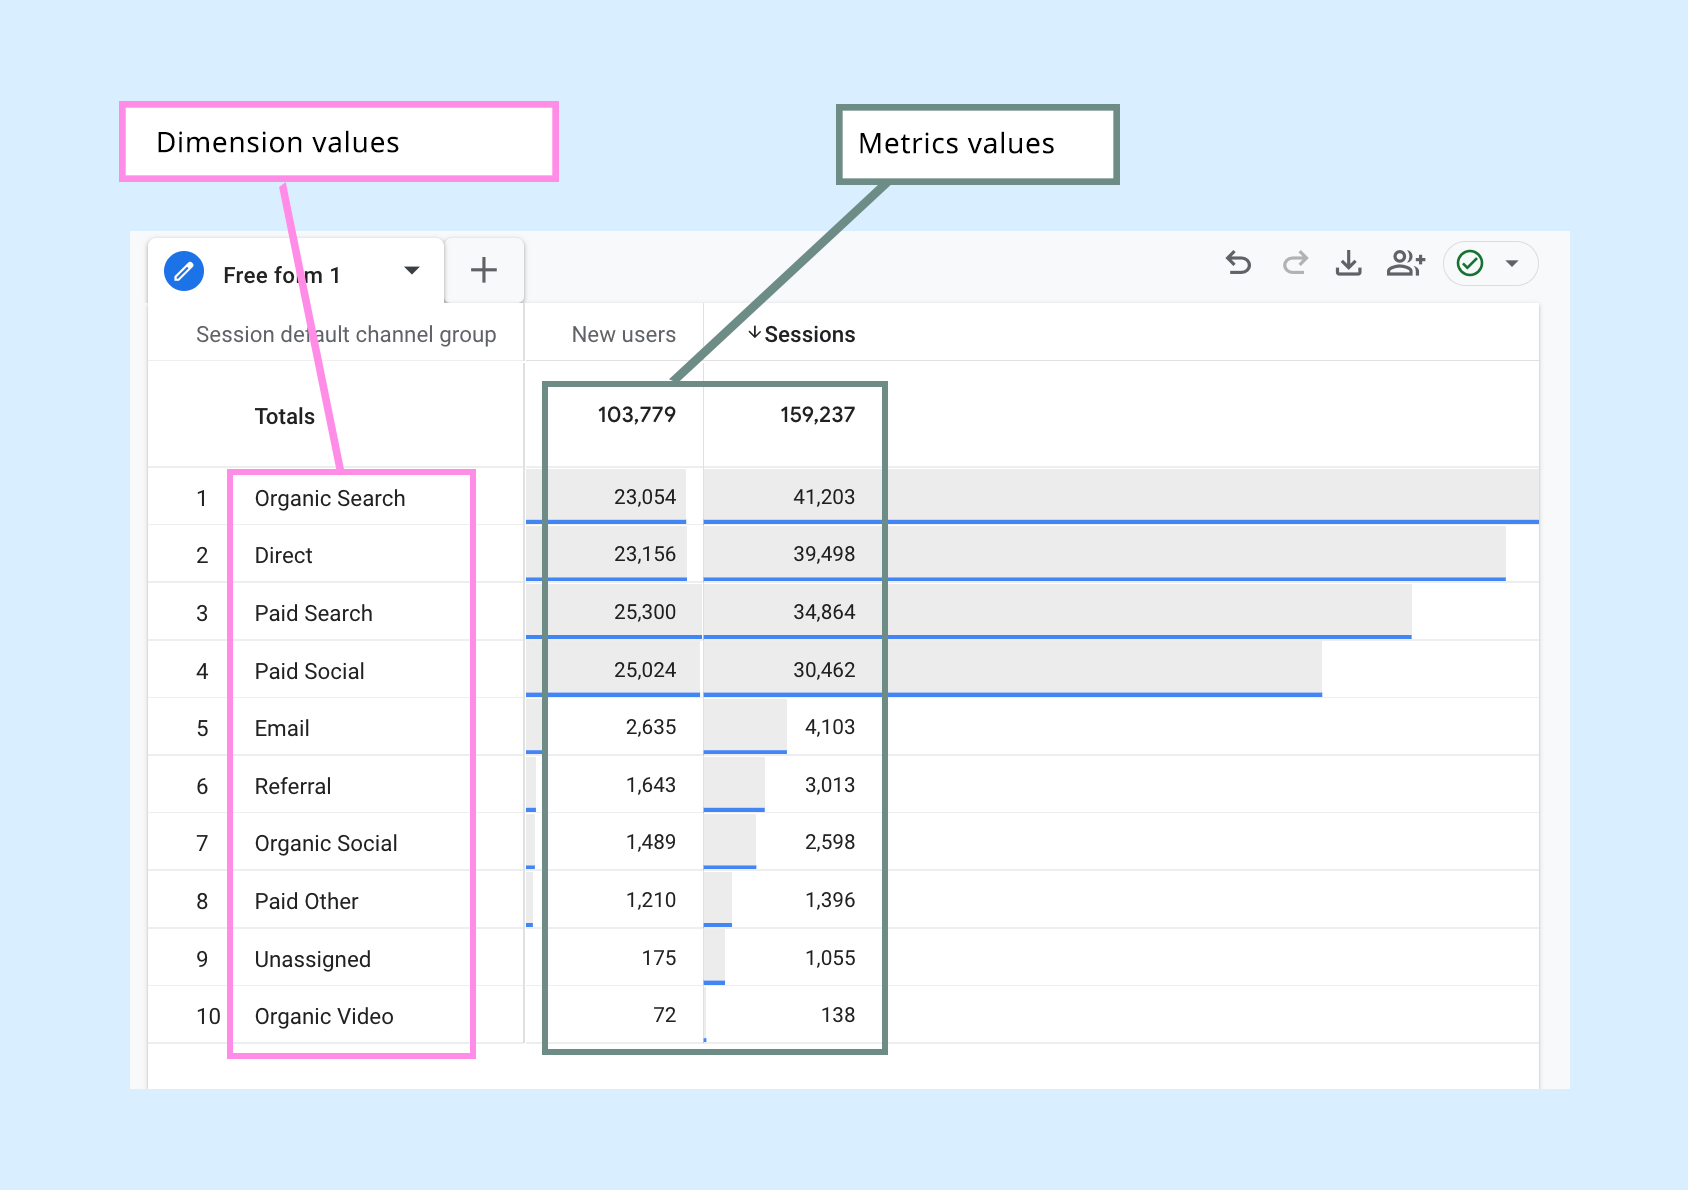
Every GA4 report is created by combining dimensions with metrics.
How to Navigate This Activity
Follow this structure carefully:
-
First, understand what dimensions are
-
Then, learn which metrics GA4 uses most often
-
Finally, see how dimensions and metrics work together in practice
What Are Dimensions in GA4?
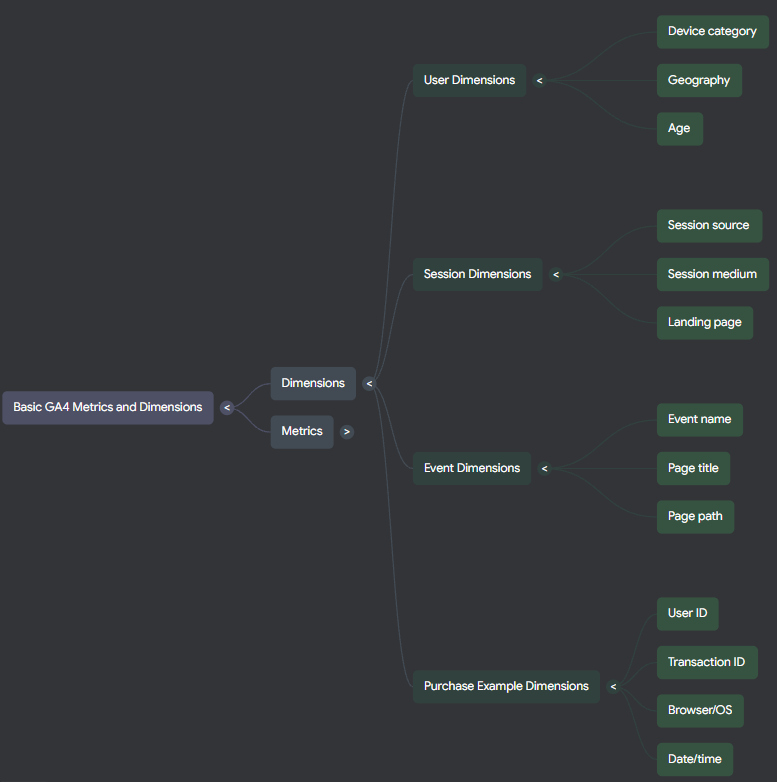
According to Google's definition, a dimension is considered a descriptive property or a specific characteristic. It provides a connection to the given numerical data. Different dimensions are used to describe different values, including events, locations, users, and so on. If a user makes a purchase in an e-shop or app, the dimensions that can be tracked in this case are:
• User ID
• Transaction ID
• Browser/operating system
• Device type
• Date/time of purchase.
Since dimensions are verbal data describing properties or characteristics in words, they are qualitative data. Based on this characteristic, we can better understand the analyzed data (Agencyanalytics.com, 2025).
4.1 Common metrics in GA4
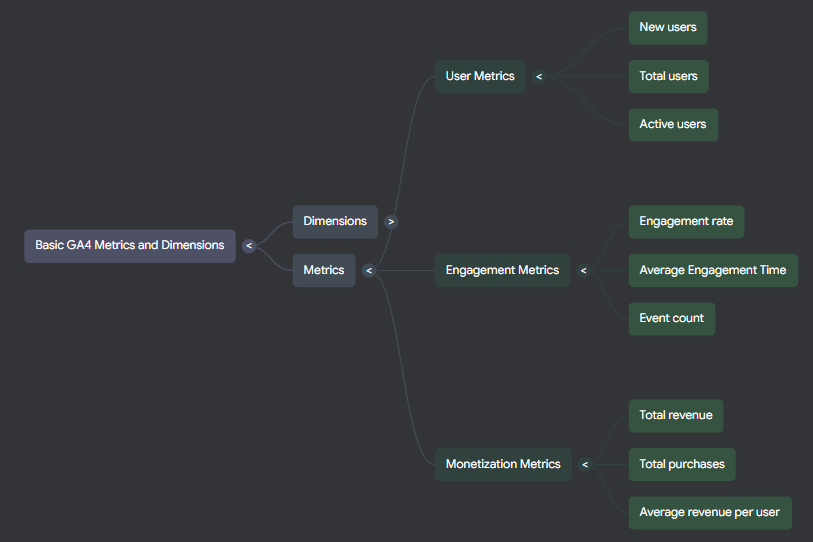
The metrics measured in GA4 are divided into user, engagement, and monetization metrics. User metrics include:
• New users – unique users who are interacting with the website or application for the first time and thus represent an event categorized as a first visit.
• Total users – the number of users who have performed at least one event, but not for the first time. Events can be entry events such as registration, signing up for a newsletter, or adding products to a shopping cart.
• Active users – are active users on our website or in the application who have performed an engaged session, which is categorized as a session lasting more than 10 seconds, performing a key event, or viewing at least two pages.
We consider the following to be engagement metrics:
• Engagement rate – the level of engagement measured as a percentage of engaged sessions on the site. If the site has a low engagement rate, there may be problems with UX or UI design.
• Average Engagement Time – the average time users spend actively engaging with the website or application over a specified period. A good average time is 52 seconds.
• Event count – the number of events performed by users to evaluate the success of specific actions on the website or in the application.
In terms of monetization, the metrics are:
• Total revenue – one of the most important metrics. This is the sum of revenue from purchases and other paid sections such as advertisements, adjusted for refunds.
• Total purchases – the total number of purchases. It is used to determine the number of users who have made at least one purchase on our e-shop. Users making their first purchase are often included here.
• Average revenue per user – average revenue per user is data obtained from each active user, including those who have not made a purchase. Based on this metric, we can determine how effective our pricing strategy is, what position we hold in the market, and how much customer loyalty we are building (Dashthis.com, 2025).
4.2 Common dimension in GA4
• Device category – the category of device indicating what type of device the user is using to visit our website or application, whether it is a mobile phone, tablet, or PC.
• Geography – the user's geography is divided into a geographical area in terms of the city from which the user comes, the region, country, or continent.
• Age – the age dimension is divided into preset categories such as 18–24, 25–34, and so on.
In terms of session dimensions, we know:
• Session source – the session source describes which website or channel the user came to the page from, whether it was Google, social networks such as Facebook, Instagram, or directly.
• Session medium – after the session source, we also record the medium. Here we are more concerned with the type of channel through which the user reached us or learned about us. This can be direct, organic search, paid advertising, or after viewing an ad.
• Landing page – this is the entry page that is displayed immediately after opening the e-shop or website. After it is displayed, the path that the user took on the page is recorded, i.e., what they viewed, what they clicked on, and so on. Based on this, we can determine how effective the page is and how well users can navigate it, i.e., we know the quality of the user experience.
We consider the following to be event dimensions:
• Event name – the name of the event describing the specific event we want to track, such as a purchase or similar. We select and set these events so that they should only be described with words, numbers, or underscores, without spaces.
• Page title – the page title is the title page set in its HTML.
• Page path – is part of the URL address (Dashthis.com, 2025).
Completion Requirements
To complete this activity, you must be able to:
✔ Explain the difference between a metric and a dimension
✔ Identify user, session, and event dimensions
✔ Distinguish between user, engagement, and monetization metrics
✔ Correctly combine metrics and dimensions conceptually