Explorations
Start a new exploration
-
Click Blank (or the + icon to start from scratch).
✅ Checkpoint: You will see a templates of various reports.
In Google Analytics 4 (GA4), Explorations are a collection of advanced techniques that allow you to go beyond standard reports to uncover deeper insights about customer behavior. While standard reports are for monitoring high-level business metrics, Explorations provide access to granular data and analytical techniques not available in standard views.
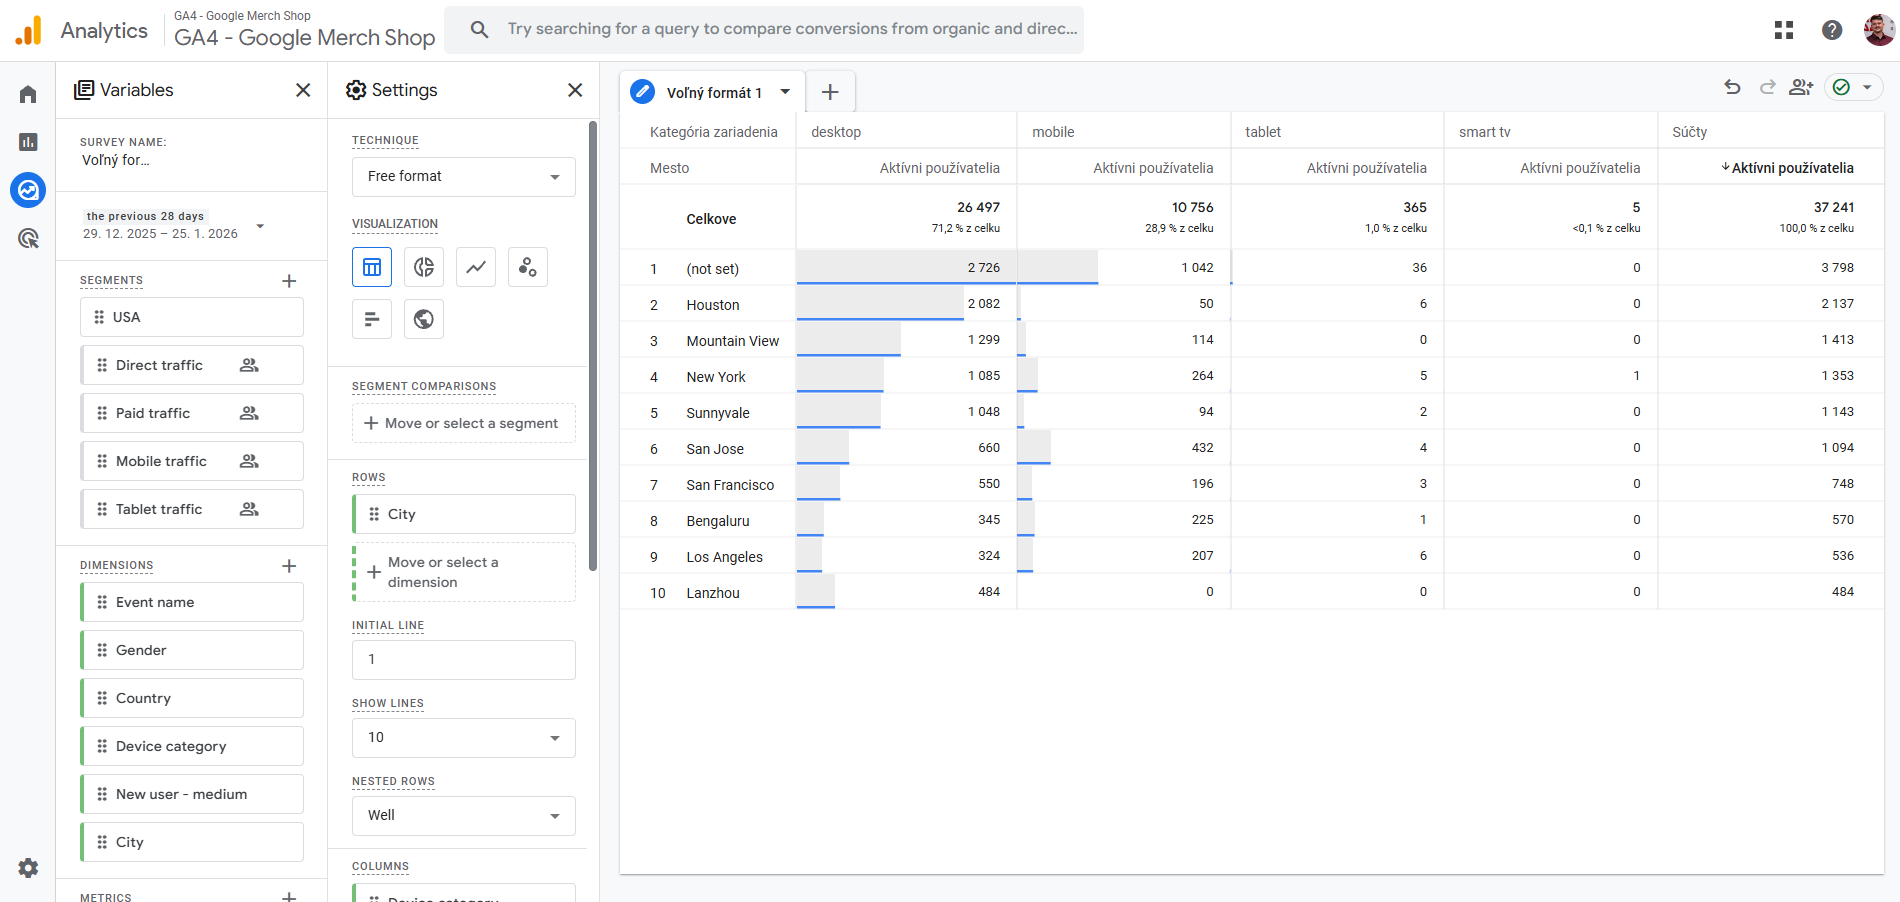
🛠️ The Explorations Interface: To access these tools, click Explore in the left navigation menu of GA4. The editor is divided into three main functional areas: Variables (Left Panel): This is your "toolbox" containing the Dimensions (categories like City or Device), Metrics (numbers like Users or Views), and Segments (subsets of users) you want to analyze. Tab Settings (Middle Panel): Here you configure the specific technique and visualization styles. You can drag and drop variables from the left panel into this section to populate your report. Canvas (Main View): This is where your data and visualizations appear based on the configurations you’ve made in the settings.
GA4 offers seven distinct techniques, each designed to answer specific business questions:
-
Free-form Exploration: The most versatile technique, allowing you to create crosstabs (tables) and various charts (bar, pie, line, scatter plots, and maps) to visualize data in a flexible layout.
-
Funnel Exploration: Visualizes the steps users take toward a goal. It helps identify where users drop off in a multi-step journey (e.g., viewing a product → adding to cart → purchasing).
-
Path Exploration: Uses a tree graph to show the sequence of actions users take across your site. It is ideal for discovering the most popular paths from a specific page or event.
-
Cohort Exploration: Analyzes groups of users who share a common characteristic, such as the date they were first acquired, to see how their behavior or retention changes over time.
-
Segment Overlap: Compares up to three user segments to see how they relate to each other. This helps identify complex audiences that meet multiple criteria.
-
User Exploration: Allows you to drill down into individual, anonymous user activities to understand specific flows or troubleshoot anomalies.
-
User Lifetime: Examines user behavior and value throughout their entire time as a customer, helping identify which marketing sources lead to the highest lifetime revenue.