Using the tables
Basic properties of the tables
It is suitable to use tables for a clear layout of text data. The table properties in the AutoCAD environment control the style of the tables, and the created table can then be changed according to the requirements in a different way than defined by the style of the tables. The window of the manager for the table styles can be opened on the “annotation” panel on the “Home” tab, or on the “Tables” panel on the “Annotate” tab (Fig. 76).
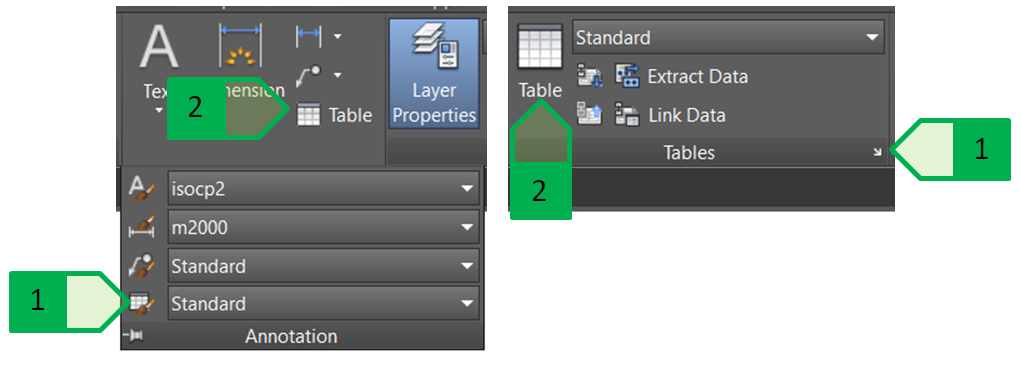
Fig. 76: Working with the tables. Working on the “Annotation” panel on the “Home” tab (on the left); working on the “Tables” panel on the “Annotate” tab (on the right); 1 - starting the manager for the table styles; 2 - insertion of a new table into the drawing
The window for the table styles (Fig. 77) consists of two parts. The left part contains the entire table data:
- for the table style, it is possible to select one of the tables as the starting table, from those already in the drawing,
- for each table style, it is possible to determine whether the table is made from top to bottom (table header at the top) or bottom up (table header at the bottom),
- the preview shows the current setting for the given table style.
The right part contains the tools for the management of the cell styles:
- the cells have three basic styles - heading, column header and data cell, it is possible to create and manage also own cell styles,
- the cell properties of a given cell style,
- the preview shows the current setting for the given cell style.
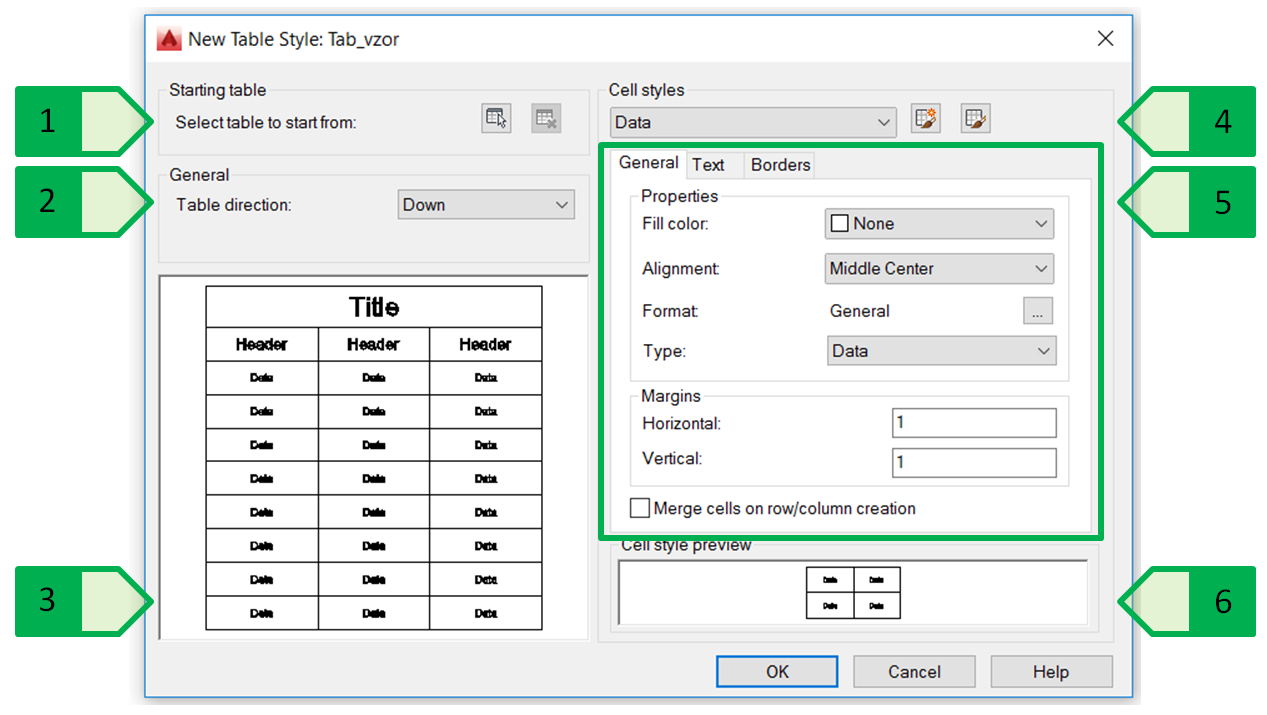
Fig. 77: Manager of the table styles, 1 - selection of the start table; 2 - table direction; 3 - preview of the table; 4 - cell style; 5 - cell properties; 6 - preview of the cell
The cell properties of a given cell style allow setting up three types of properties:
- general - background colour, alignment, format, type, text offset from the bottom and left margins of the cell,
- text - style, height, colour, angle,
- border - thickness, line type, colour, double border option.
Creating a new table
The use of the tables will be explained in an example of the sewer pipe report in the new part of the municipality Veľký Lapáš (Fig. 78), where we will create a table summarizing the diameters, the total lengths and the material of the individual pipes of the sewer system.
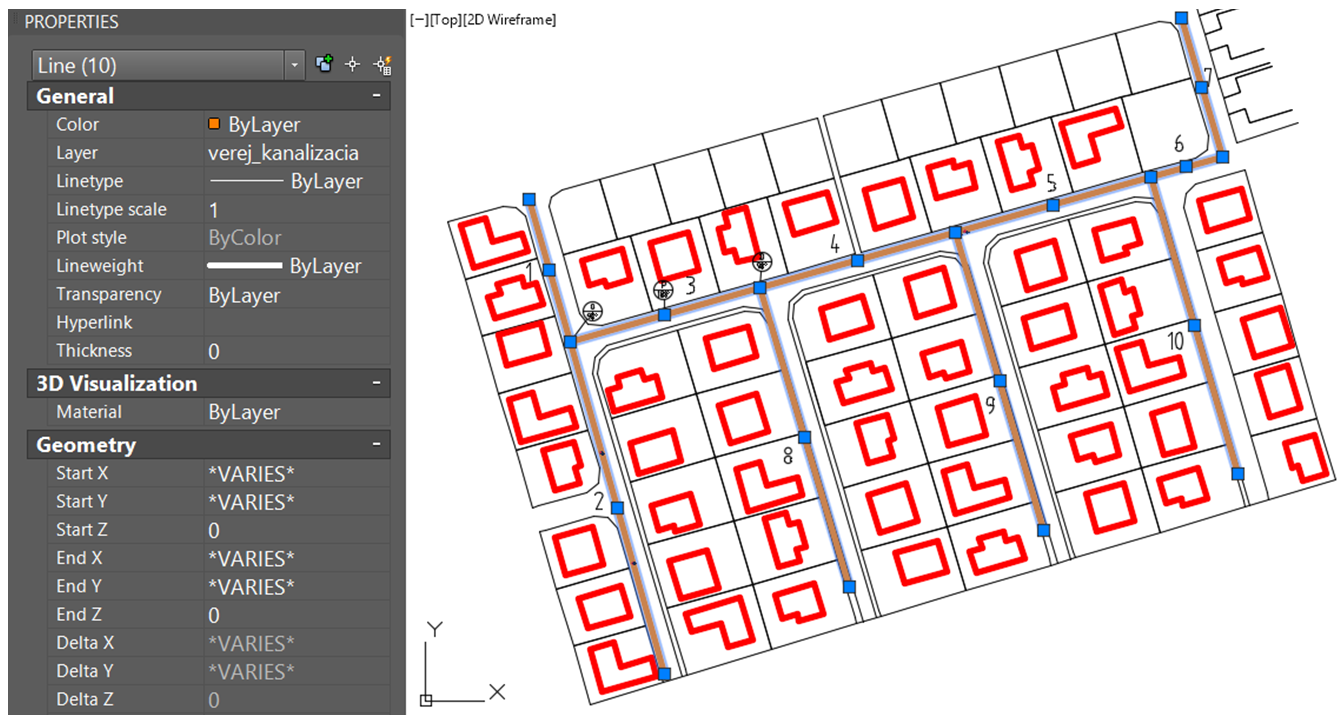
Fig. 78: Sewer pipes in the area in question
Since there are ten branches of pipes in the site and each is described by four parameters, we create a table with ten data rows and four columns, where the first row will be the heading and the second row will be the column header (Fig. 79).
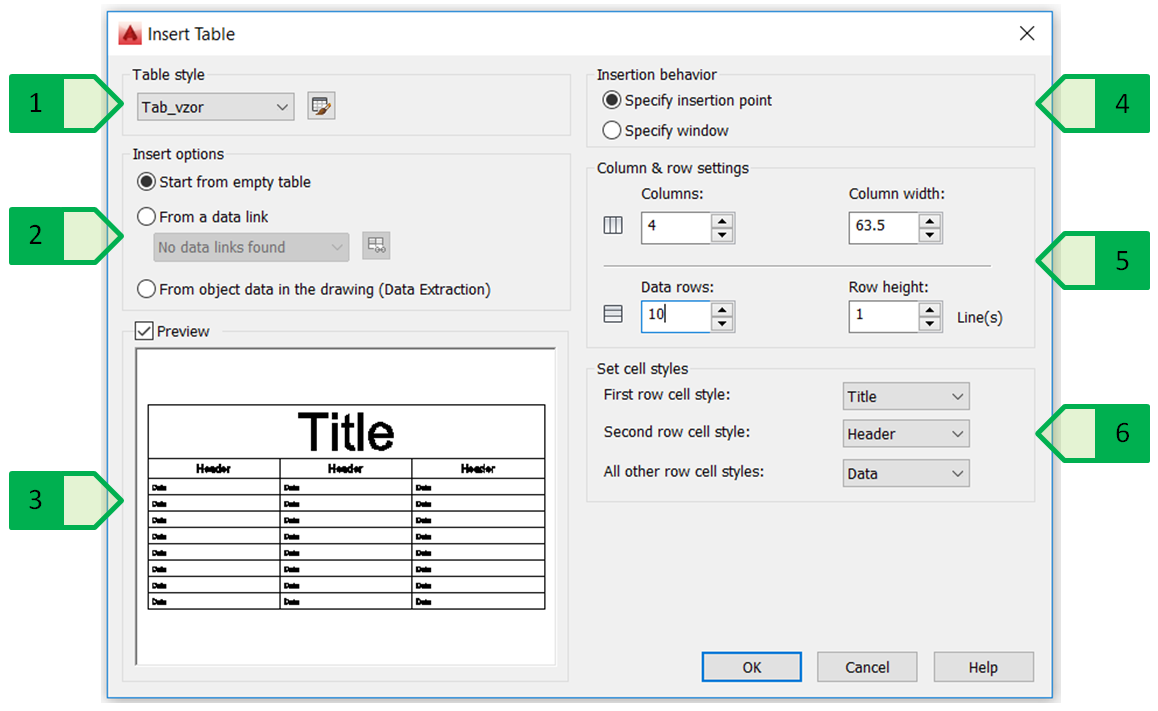
Fig. 79: Inserting the table. 1 - selection of the table style; 2 - selection of the table type (empty table, table linked to the MC Excel spreadsheet), table for the extraction of object data in the drawing); 3 - preview of the table; 4 - insertion method (insertion point or window); 5 - setting the columns (number and width) and the rows (number and height); 6 - determining the style of the first, second and all other rows
After inserting the table into the drawing, fill in the heading and header of the columns and enter the parameters for each pipe. The width of the columns can then be adjusted as necessary with the horizontal grab points of the cell in the required column (Fig. 80). We can also adjust the row height in the same way.
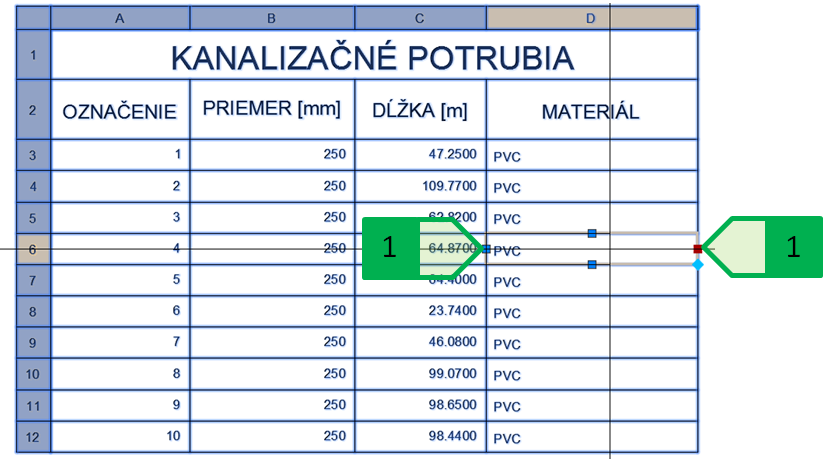
Fig. 80: Inserting the table of the sewer pipe into the drawing, 1 - grab points for the adjustment of the column width
If necessary, we can also adjust the cell dimensions on the properties palette:
- column width - “Cell width”
- row height - “Cell height”
- text offset from the bottom edge of the cell - “Horizontal cell margin” (the parameter does not appear if the cell text is aligned to the centre of the cell in the horizontal direction),
- text offset from the left edge of the cell - “Vertical cell margin” (the parameter does not appear if the cell text is aligned to the centre point of the cell in the vertical direction).
We modify the columns of individual pipes so that both the heading and data cells of this column are aligned to the middle left of the cell, we adjust the columns of the average, length and material so that both the heading and data cells of this column are aligned to the central point of the cell and we adjust the data cell of the pipe length to the decimal point number rounded to two decimal places (Fig. 81).
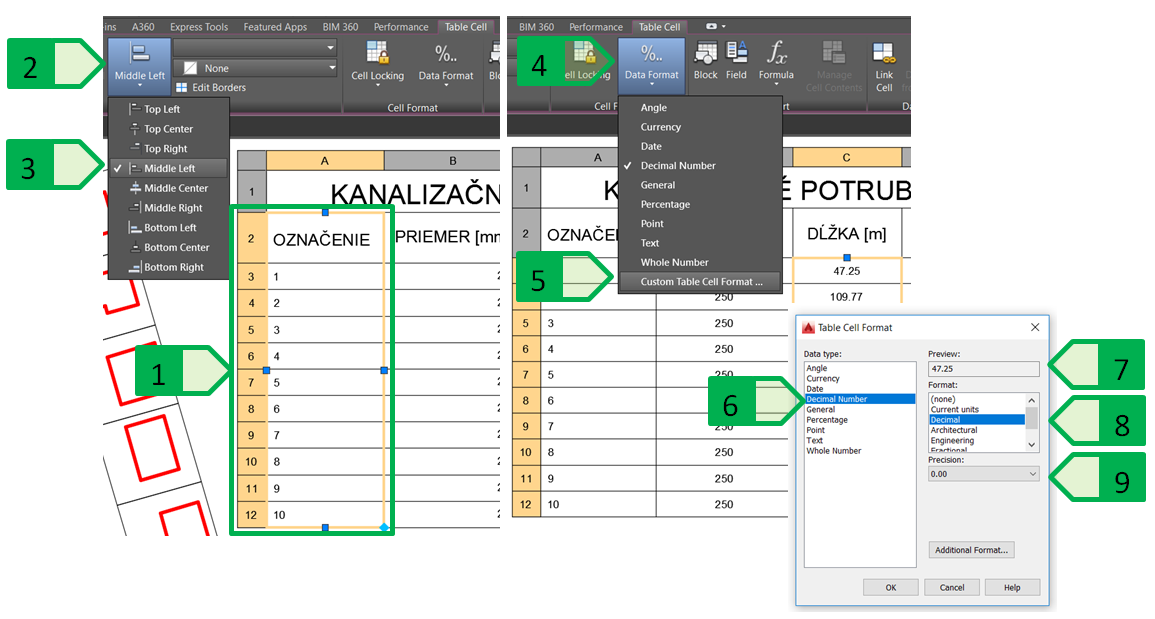
Fig. 81: Adjusting the cells. Setting of the alignment for the cell content (on the left); Setting the content format (on the right); 1 - selected cells; 2 - cell alignment button; 3 - selection of the alignment to the middle central point; 4 - cell size format button; 5 - selection of the type of cell content; 6 - decimal format; 7 - preview of the formatted value; 8 - format type; 9 - rounding to the required number of decimal places.
Basic table adjustments and operations
In addition to the basic adjustments of the existing tables, such as the editing of the dimensions, alignment, and formatting of the cell contents, other adjustments and operations are commonly used in table editors. In the case of the sewer pipe table, we will create another row in which we use the formula for calculating the total pipe length.
The rows or columns can be added either by using the tools from the “Rows” (lines) panel or the “Columns” (columns) panel on the “Table cell” (tab, or by using the local menu which is displayed by clicking the right button of the mouse (Fig. 82).
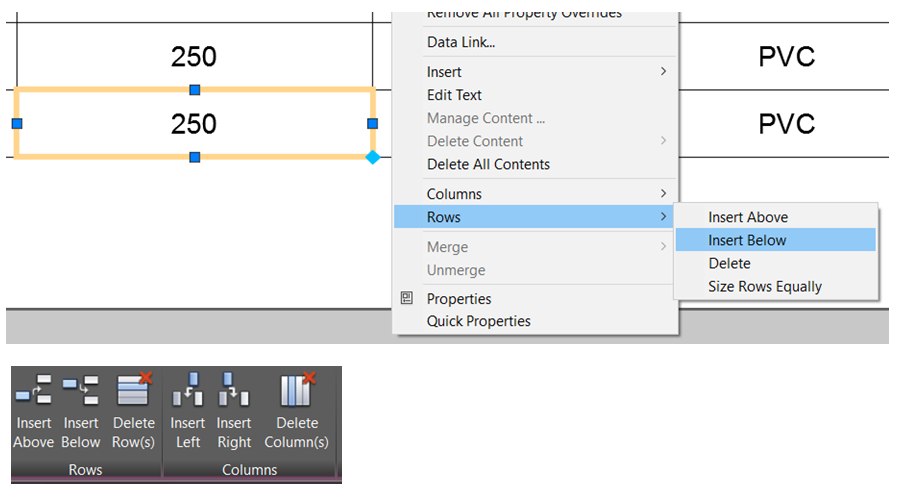
Fig. 82: Adding and removing rows and columns. Using the local menu displayed after clicking the right button of the mouse (at the top); Using the tools on the “Rows” and “Columns” panels on the “Table cell” tab (at the bottom).
After inserting a row at the end of the table, we calculate the total length of the pipe using the formula.
The AutoCAD program allows using these basic formulas:
- “Sum” - sum of the selected range values (empty and non-numeric values are ignored),
- “Average” - average of the selected range values (empty and non-numeric values are ignored),
- “Count” - the number of cells containing numeric values from the selected range (empty and non-numeric values are ignored),
- “Cell” - the value of the selected cell (the non-numeric value of the selected cell displays an error in the cell in question - ####),
- “Equation” - a formula that uses basic mathematical operations with the option to enter a cell or cells from the existing table (the non-numeric values of the cells entered will display the error in the cell in question - ####).
The calculation of the total length of the pipes is done by entering the formula “=Sum(C3:C12)” as the pipe lengths are entered into the cells C3 to C12. In addition to the direct entering of the formula text, we can specify this formula by using the “Formula” tool on the “Insert” panel on the “Table cell” tab or by using the local menu that appears when we use the right button of the mouse (Fig. 83). The formulas, or the values calculated by the formulas are standardly displayed with a grey background - the highlighted text indicates that it is a formula (or field) that is updated depending on the input values, or on the object parameters. After entering the formula, we modify the format of this cell to the format of the decimal number rounded to two decimal places.
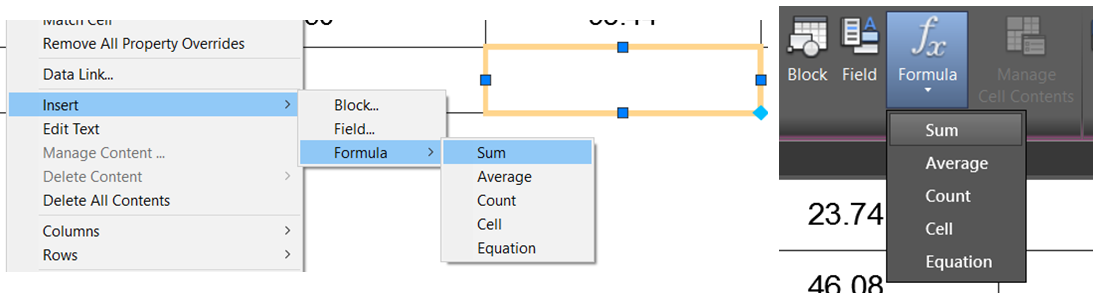
Fig. 83: Inserting the formula into the cell. Using the local menu displayed after clicking the right button of the mouse (on the left); Using the tool “Formula” on the “Insert” panel on the “Table cell” tab (on the right).
The cells to the left of the total length of the pipe are merged to form one cell. We merge the cells after the marking of the required cells and using the “Merge” tool on the “Merge” panel on the “Table cell” tab or by using the local menu that appears when we use the right button of the mouse (Fig. 84).
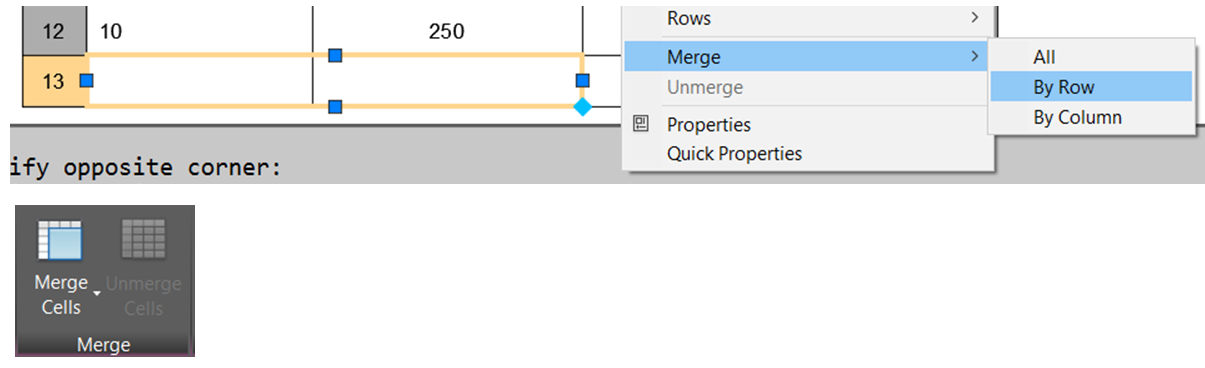
Fig. 84: Merging multiple cells into one cell. Using the local menu displayed after clicking the right button of the mouse (at the top); Using the tool “Merge” on the “Merge” panel on the “Table cell” tab (at the bottom).
We add the text “Total pipe length:” into the merged cell and we align the cell content to the right central point of the cell.
The table created in this way (Fig. 85)can then be used as part of the project documentation.
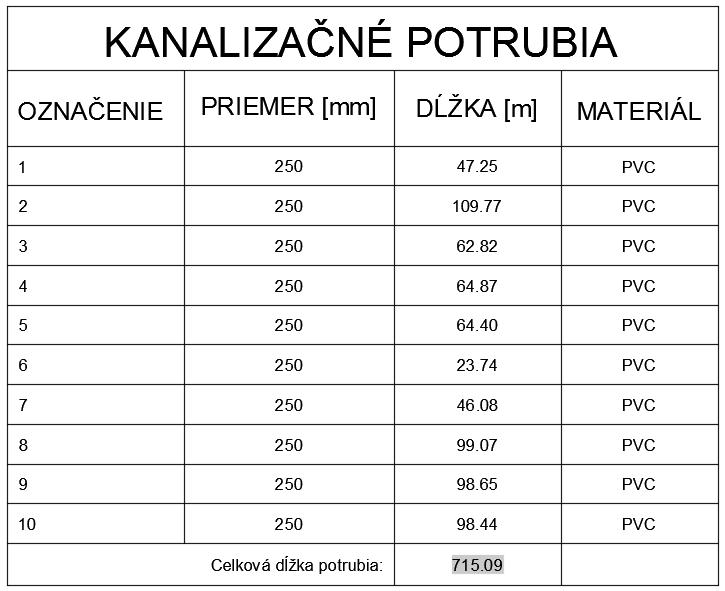
Fig. 85: Resulting table of the sewer pipes