Creating the scripts
A simple preview of the script is the creation of a line from the point [10,20] to the point [50,100] and then the subsequent setting of the display so that all entities in the drawing are displayed in the drawing window, in this case only this line.
When working without a script, the procedure would be as follows:
1. using the command to draw a line (click on the icon, select in the drop-down menu, or enter the command “_line” in the command line)
2. entering the starting point of the line as the absolute coordinates [10,20] entered in the command line
3. entering the end point of the line as the absolute coordinates [50, 100] or as the absolute coordinates [@40,80] entered in the command line
4. stopping the command to draw a line (press the “Enter”, “Escape” button or the space bar)
5. using the command “ZOOM” (click on the icon, select in the drop-down menu, or enter the command “_zoom” in the command line)
6. selecting the option to zoom in on all objects in the drawing (select the keyword “Extens” in the command line or enter the value “e” in the command line)
Note: The commands are given using the underscore, as in the case of language mutations in the AutoCAD program, there are also changes to the names of the individual commands. In the case of the Czech language mutation, the command for the drawing of the line is “ÚSEČKA” and therefore the English command “LINE” will not work. But if we use the underscore and the English name of the requested command, this command will work in each language mutation.
This entire procedure, which is only entered through the command line, is as follows:
1. _line↵
2. 10,20↵
3. 50,100↵
4. ↵
5. _zoom↵
6. e↵
The entry in the form of a script can therefore be done in a very similar way, or it can be done in a more structured form, where the design of a line will be done in one row, and the second row will be there for the setting of the zoom-in. In case of scripts, it should be noted that the confirmation of a given command or value can be done with one of two characters - using a space or a new row (Fig. 125). Subsequently, it is necessary to change the file extension from *.txt to *.scr.
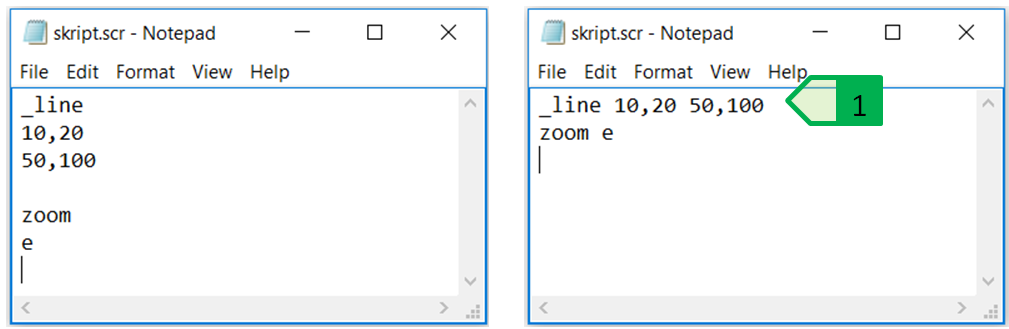
Fig. 125: Options for structuring the content of the script file. Entering the particular input data always into a new row (on the left); entering the particular work steps into the rows for a complete steps; 1 - first row ending with a space to confirm the entered coordinates of the end point.
Using the script is done using the command “SCRIPT” or using the “Applications” button on the “manage” tab (Fig. 126) and selecting the respective *.scr script file we want to use.
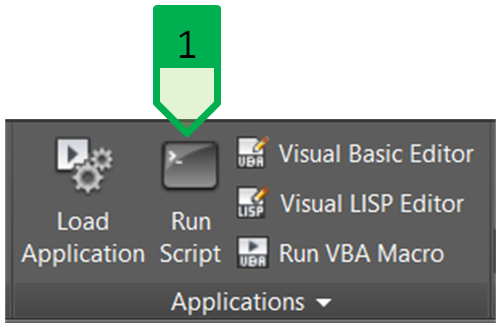
Fig. 126: Using the script from the “Application” panel on the “Manage” tab; 1 - button to use the script
After the script is started, all the actions defined in the file with the currently set parameters of the program are performed (layer, colour, line thickness, etc.). When creating a drawing using a script, when the script also contains the required coordinates, or the angles and dimensions, it is advisable to turn off the modes for the use of the grab points and tracking (OSNAP - F3; AUTOTRACKING - F11), since the entering of the coordinates could use snapping and tracking with the turned-on modes which would change the required geometry defined in the script.
Creating the path from the geodetic measurement
In the practice of landscape planning, we can normally encounter tasks requiring the drawing of geodetically measured objects. In general, we can say that there are a series of points that can form separate point objects (e.g. planimetry, topography), line objects (e.g. shore line, path axis), or area objects (e.g. building, plot). Nowadays, the software for the work with geodetic data nowadays normally allows the export of measured data in the format used in the CAD programs (*.dxf or *.dwg files), but it is still possible to encounter data in the form of a text describing the coordinates and various attributes of the measured points.
In case of the Radošinka stream, the axis of the road between the villages of Zbehy and Čakajovce was measured. The points at the top of the road in the direction Zbehy - Čakajovce were geodetically measured and the coordinates and ordering numbers for the measured points in the format of a *.txt file were used. (Fig. 127).
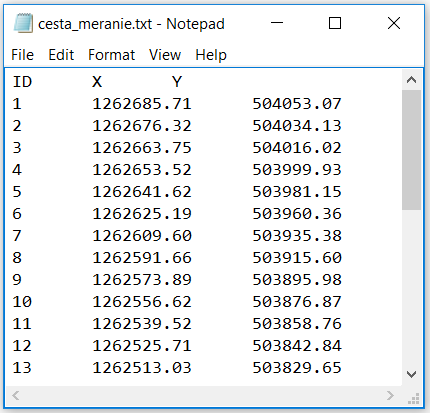
Fig. 127: Sample of the file with the measured points of the road axis between the villages of Zbehy and Čakajovce
It would be rather lengthy to manually create a route of the road axis from the measured points (by specifying the coordinates of the measured points in the command line), so we can use the option of creating a script that creates the lines automatically. To create a script, we first import the measured data into the spreadsheet program (MS Excel), where we process them into the desired form.
First, we modify the S-JTSK coordinates for the use in the CAD environment - we interchange the axes X and Y and enter the values in the negative format (see chapter “S-JTSK coordinate system in the AutoCAD environment”). Then we create the contents of the script file, where we enter a line creation command in the first row and in the other rows the coordinates of the measured point will be specified. Since the point name - number rises in the order of the measurement, the next point is always the following point of the road axis. Creating a pair of coordinates separated by a comma is solved by the “CONCATENATE” function, which combines the contents of the cells, or ext data - in our case, the cell with the coordinate X, the text containing the comma, the cell with the data of the coordinate Y (Fig. 128).
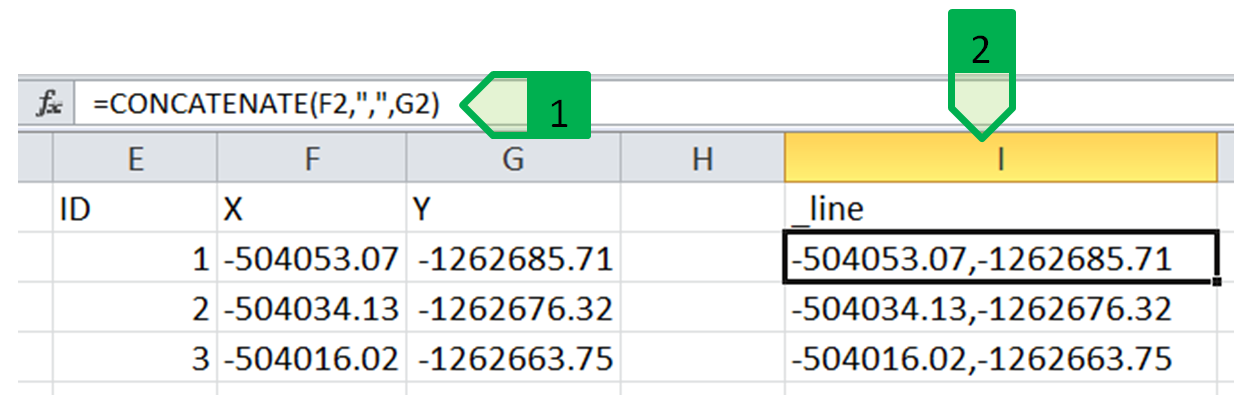
Fig. 128: Creating the script text in MS Excel, 1 - formula for linking the cells with the coordinates and the text containing a comma; 2 - column “I” containing the script text
Behind the row of the coordinate of the last point, it is necessary to enter two characters (two spaces, a space and a new row or two new rows) because we need the program to make two confirmations - for the first time to confirm the last coordinate and for the second time to confirm or to end the command for the line design - the equivalent of pressing the “Enter” key (Fig. 129).
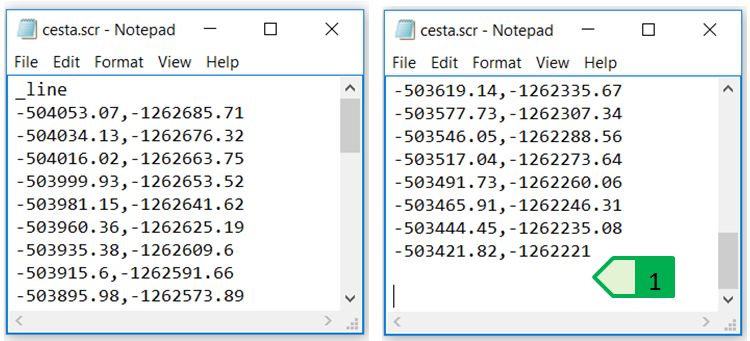
Fig. 129: Script for creating the design of the of the measured top of the road; beginning of the file (on the left); end of the file (on the right); 1 - two empty rows for two confirmations of commands or values
Then we change the file extension and we can start the script. In case of the Radošinka stream, we can start the script directly in the drawing, which will create the design of the measured top of the dam directly on the background of this drawing so as the currently set program (Fig. 130).
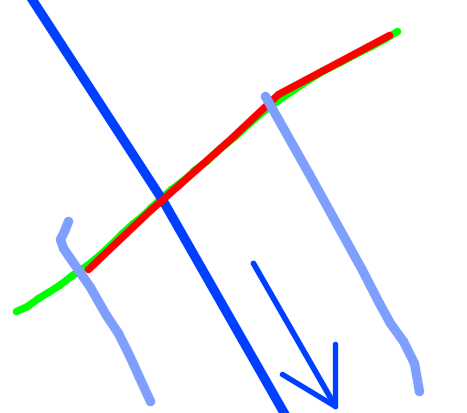
Fig. 130: Road created from the measured top of the road; road created from the lines using the script from the measurement (green); road created from the original documentation (red)
Using this script, we created 3é lines between 31 points that had been geodetically measured. Since, in case of the line lines, the use of continuous lines (”Polyline” type entities) is more appropriate for the progress of their individual parts (axes, shores, road shoulders, etc.), the script can be changed because the creation of the continuous line is very similar to the the creation of the lines (keyword - node coordinates - completion of the command) - it is enough to change the keyword “_line” “_pline” and the resulting drawing will be a continuous line crossing the geodetically measured points.
Inserting the blocks and filling in the attributes using the script
With scripts, it is possible to insert blocks with attributes, but the script structure needs to be changed. Since some commands in the AutoCAD program work with a dialogue box where we performs the settings or properties, it is necessary to use commands in the scripts in a way that solves the use with entering the parameters using the command line without opening their dialogue boxes.
Starting a command by suppressing the dialogue box and entering the input using the command line is solved by entering the command with a hyphen before the keyword, e.g. the block insertion is performed with the command “-INSERT”.
Note: This function works for a large number of commands, but not for all, so when using scripts, it is good to first verify the functionality of the required command without a dialogue box before creating a script.
Another change is the confirmation of attribute input. Since when we use attributes, it is also possible to enter text data containing a space, it is necessary to confirm the input of the attribute value in a different way. Since the use of a spreadsheet editor for script creation is based on the one-row principle for executing a single command (block insertion and attribute input), it is also not appropriate to use this method. Therefore, as a character to confirm the attribute input we use a special character, the so-called carriage return, whose Unicode character is “\U+000D”.
The possibilities of this solution will be demonstrated in the situation of the Radošinka stream, where a dendrological survey was carried out with a geodetic measurement of the trees position. The survey results were delivered in the form of a set of coordinates and attributes for the individual trees. Then it is necessary to draw the location of the trees and individual attributes in the drawing.
For these purposes, we create a block of attributes (Fig. 131) consisting of a schematic tree display and four attributes for the particular parameters of each tree.
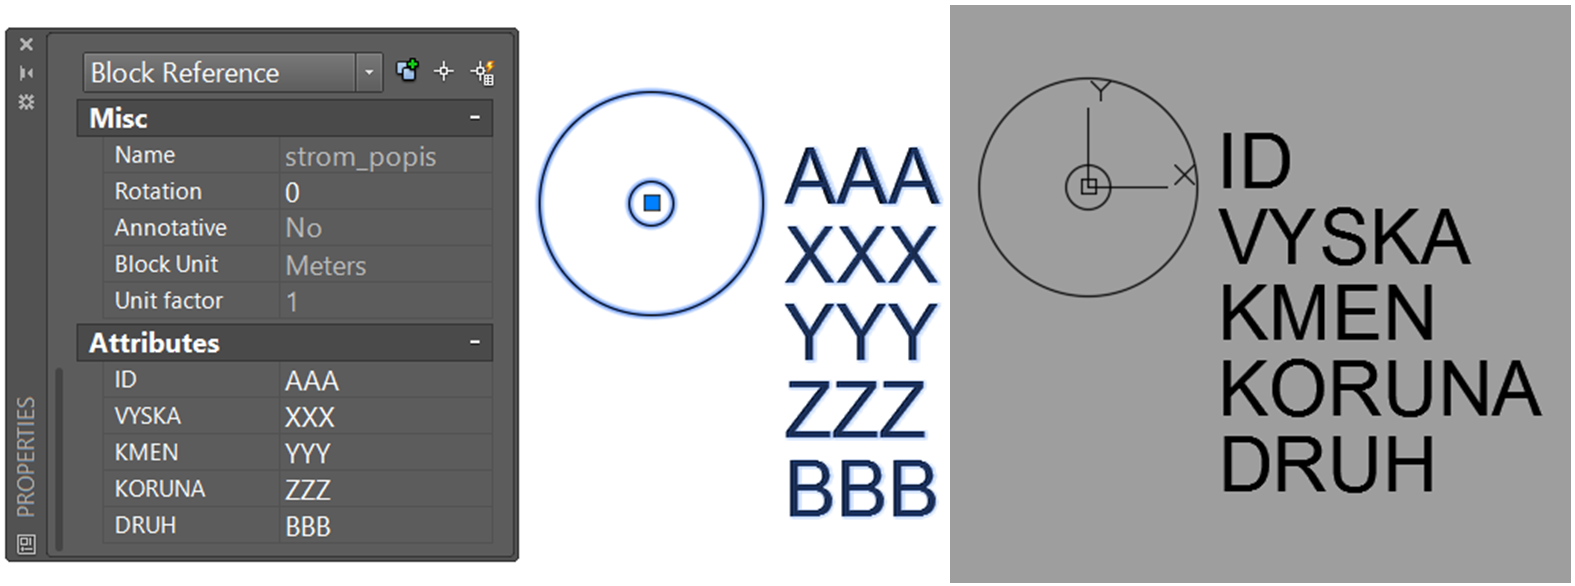
Fig. 131: Tree block with attributes (tree umber, height, trunk perimeter, tree-top perimeter)
Then, in MS Excel, we process the provided data (Fig. 132) to create a script that automatically inserts the tree block into its real location and fills in its attributes according to the dendrological survey.
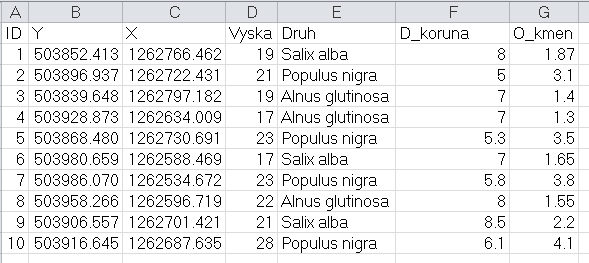
Fig. 132: Data provided by the dendrological survey and the geodetically measured coordinates of the position of trees
Starting the command for inserting a block named “tree_description” and filling in the attributes is solved by the following order of entered parameters:
1. -insert↵
2. tree_description↵
3. coordinate_X,coordinate_Y↵
4. scale_x block ↵
5. scale_Y block ↵
6. angle of block rotation↵
7. tree number↵
8. tree height↵
9. trunk perimeter↵
10. tree-top perimeter↵
11. type↵
12. “OK” button
The script will then be created in the way that the insertion text of one tree block and the filling-in of the attributes will be performed by using the “CONCATENATE” function, from the provided data and required block parameters (scale, block rotation angle) for the first row, and then applying it for each row and therefore for each tree according to its parameters (Fig. 133).
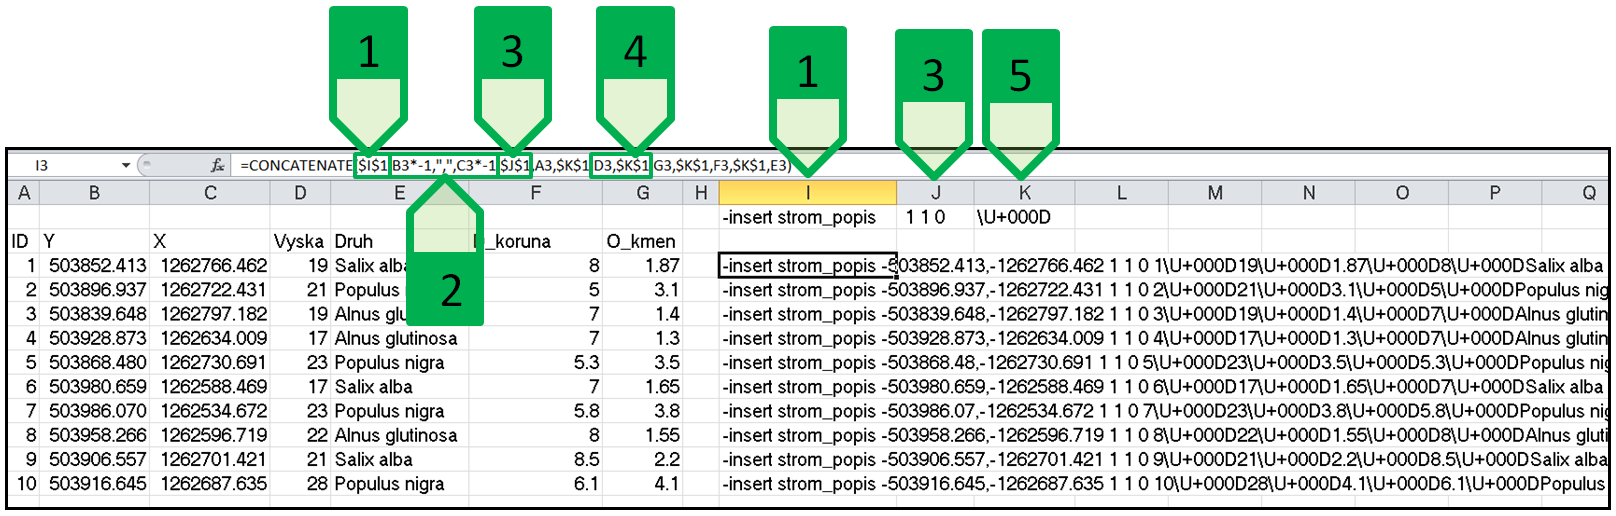
Fig. 133: Script for inserting a tree block with attributes and entering the attribute values without using a dialogue box, 1 - starting the command and entering the block name; 2 - entering the input coordinates with the conversion of geodetic coordinates for use in the AutoCAD program; 3 - entering the scale in the X and Y directions and entering the block rotation angle; 4 - entering the attribute value and the confirmation using the Unicode character “carriage return”; 5 - cell containing the Unicode character “carriage return” to simplify the work
The last attribute will only be confirmed by inserting a new row without using the Unicode character “carriage return” because starting a new row will terminate the block insertion with entering the value of the last attribute.
The script created in this way can then be run for inserting and filling in the attributes from the provided documents (Fig. 134), which, in case of large-scale projects, will greatly simplify the work because it is not necessary to insert and fill in each block individually. This will make the operation much shorter and eliminates the possible errors that occur when you manually enter the attribute values or the position of the block insertion.
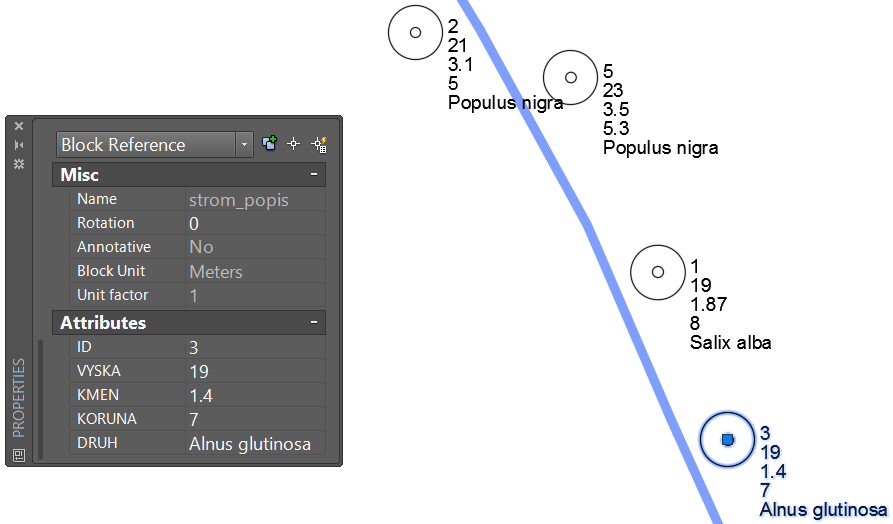
Fig. 134: Resulting dispaly of several trees with attributes filled in according to the dendrological survey