Activity 6 Introduction to Reports
In this activity, you will learn how to read, interpret, and connect GA4 reports into a meaningful analytical story.
Do not treat reports as isolated dashboards. Always move through them in the following logical order:
Acquisition → Engagement → Events → Monetization → Retention
This sequence mirrors the user lifecycle:
how users arrive → how they interact → what actions they take → how they generate value → whether they return.
For each report:
-
Observe the screenshot carefully
-
Identify key metrics and dimensions
-
Answer the practical questions below
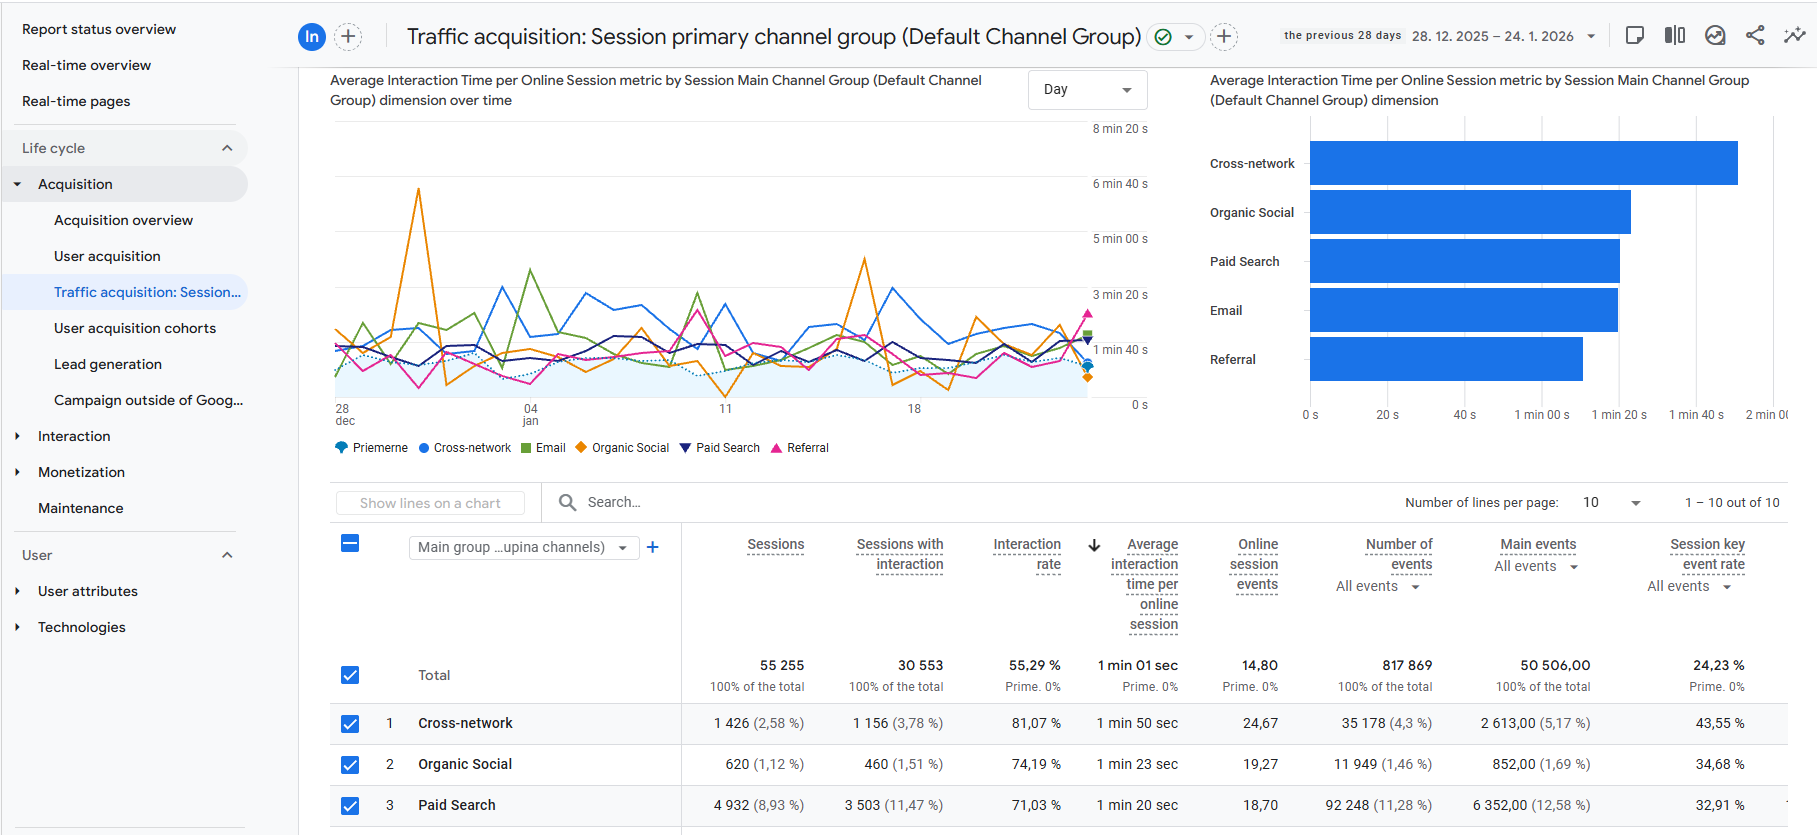
User acquisition report
is a report on user acquisition that shows in GA4 how new users appear on our website or in our application. Through this report, we track where they come from, i.e. from which channels, sources, media, and whether they come from marketing campaigns, advertisements, and the like. We use the report primarily to identify the most used marketing channels, improve the user experience in terms of the purchasing process, and support marketing, campaigns, and advertisements, whether on social networks, through influencers, or through referral programs.
Start by identifying:
-
which channels bring the most users,
-
which channels bring the most engaged users,
-
whether paid channels outperform organic ones.
Key Insights (Highlights)
-
Not all traffic is equal — high volume does not always mean high quality
-
Strong acquisition without engagement often indicates targeting problems
-
This report answers “Which channels deserve more budget?”
Practical Questions (From the Image)
-
Which channel has the highest number of sessions?
-
Which channel shows the highest engagement rate?
-
If one channel has many users but low engagement, what might be the reason?
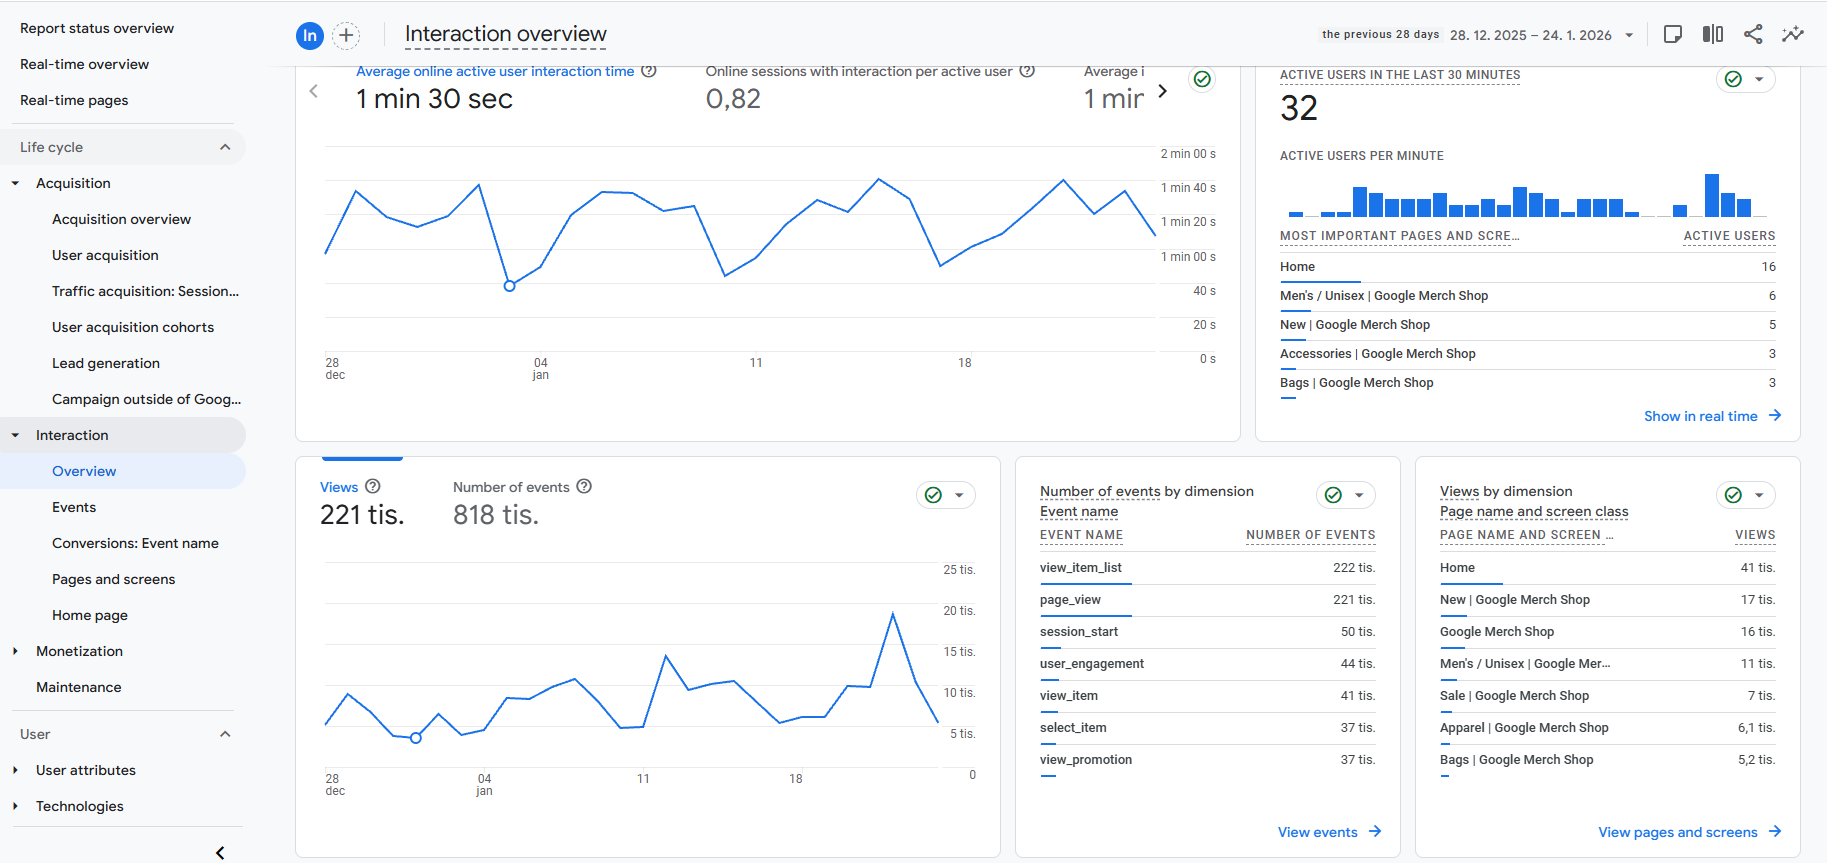
Engagement overview
an overview of how users interact with our website or application. A session is defined as a visit lasting 10 seconds or more, viewing more than two pages, and completing a conversion. We use the report to find popular features, problem areas, tailor communication and marketing, and increase retention, loyalty, and conversions.
Look for:
-
average engagement time,
-
engaged sessions per user,
-
most viewed pages and screens.
Key Insights (Highlights)
-
High engagement usually indicates good UX and relevant content
-
Sudden drops may signal usability or content problems
-
Engagement connects acquisition with conversions
Practical Questions (From the Image)
-
What is the average engagement time shown?
-
Which pages receive the most views?
-
Would you describe user interaction as strong or weak? Why?
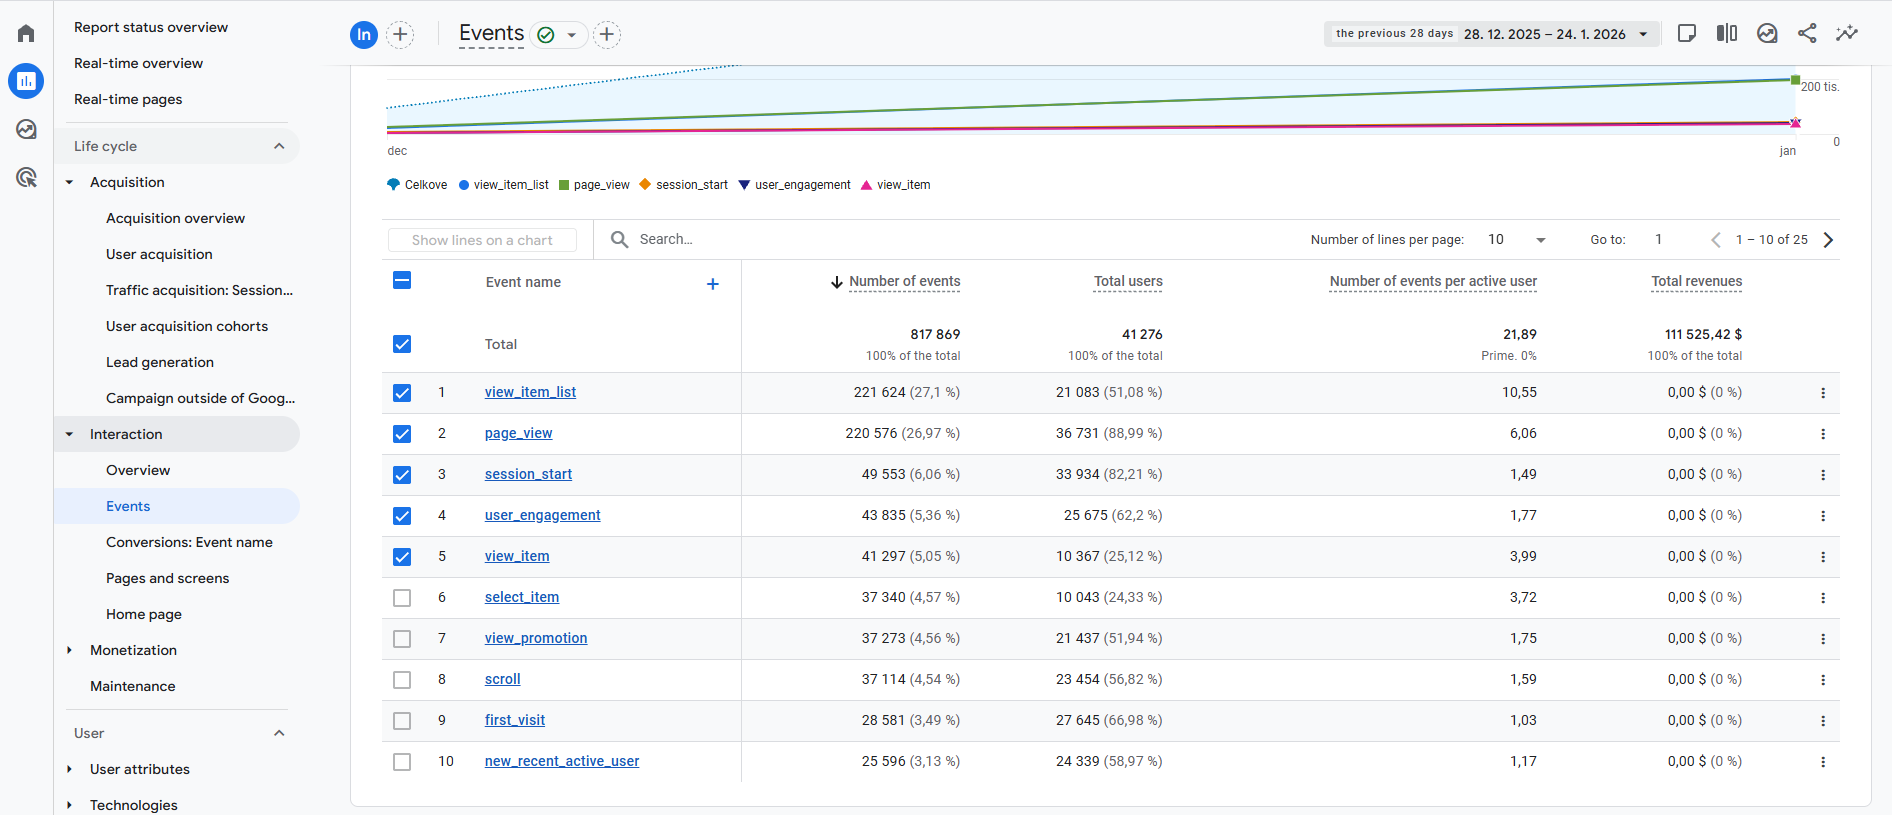
Events report
an overview of events in terms of specific actions that have been performed, such as clicking a button, submitting a form, or playing videos. We use it to identify interactions, analyze behavior, popular events on an e-shop or application, customize the environment, set up conversion events, and measure key actions important to success.
Focus on:
-
most frequent events,
-
events tied to business goals,
-
relationship between events and engagement.
Key Insights (Highlights)
-
Events reveal real behavior, not assumptions
-
High event counts without conversions may indicate friction
-
Events can later be marked as conversions
Practical Questions (From the Image)
-
Which event has the highest number of occurrences?
-
Which events indicate strong purchase intent?
-
Are key events aligned with business goals?
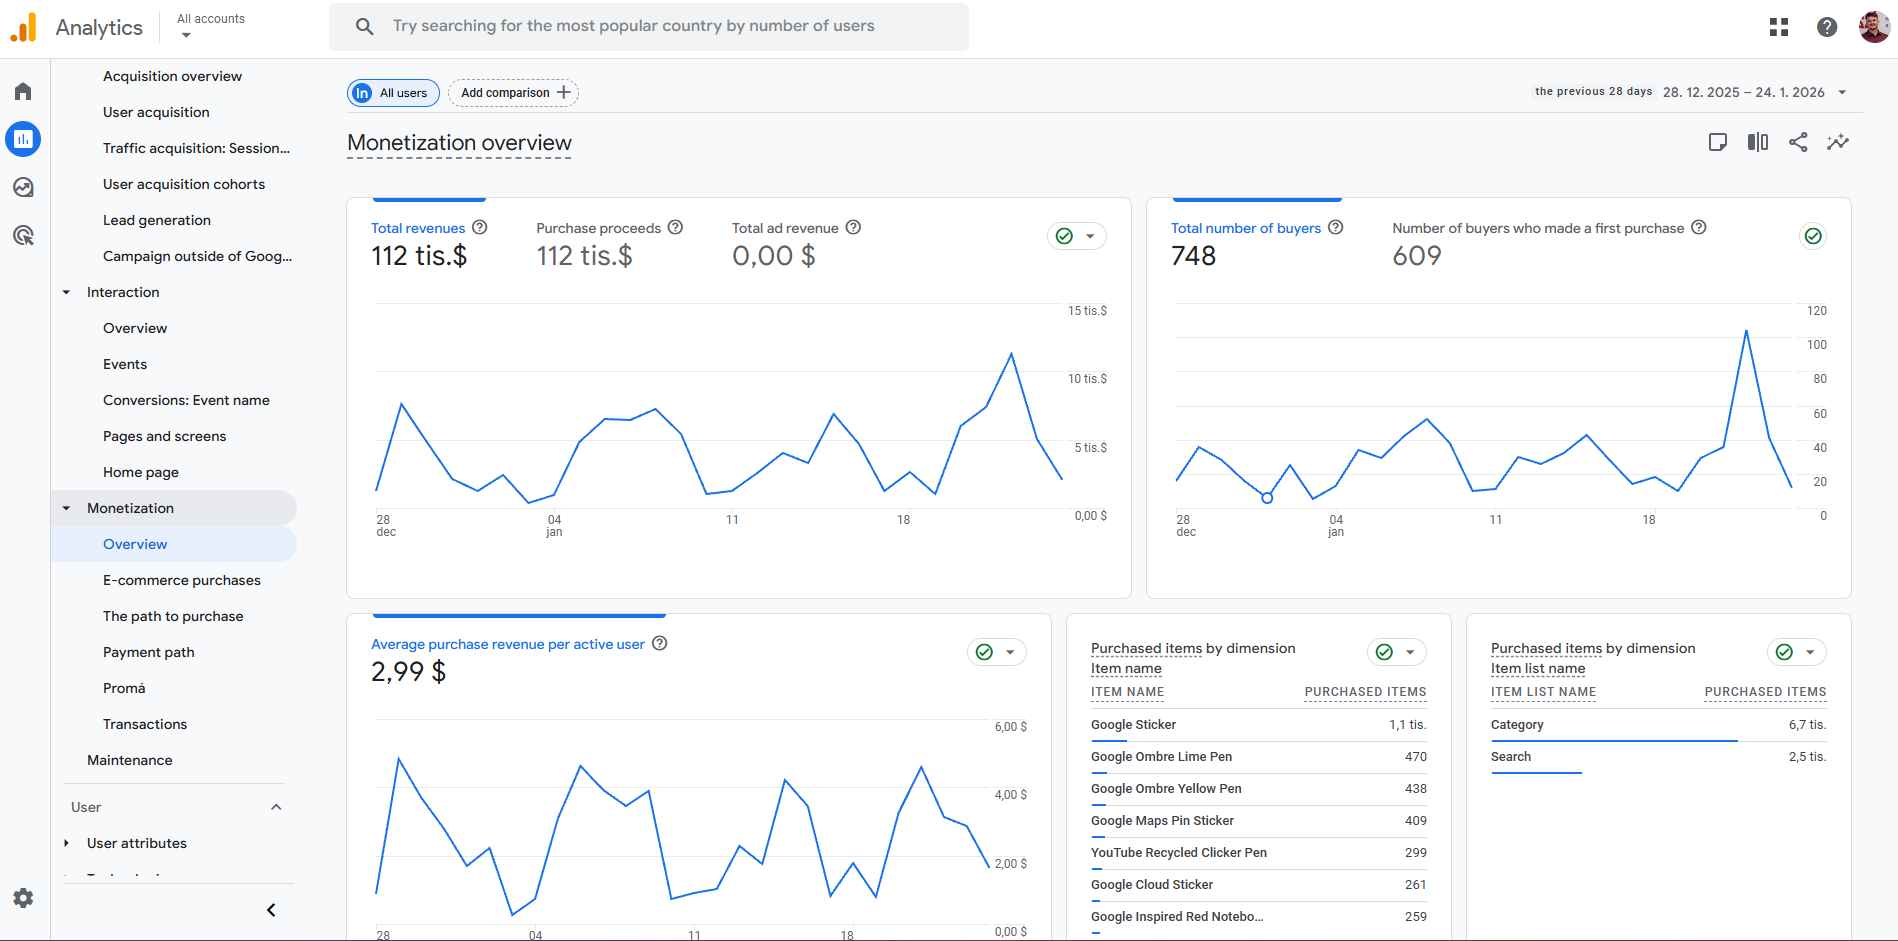
Monetization overview
overview of profitability, performance, transactions, sales, and products in e-commerce. We use this type of report to analyze sales performance, trends, and popular products. We segment our customers to better understand what influences their behavior, evaluate the performance of products and product categories, optimize the purchasing process, and improve conversions. All within the framework of effective marketing campaigns.
Analyze:
-
revenue trends over time,
-
differences between buyers and users,
-
product-level performance.
Key Insights (Highlights)
-
Revenue must be interpreted together with engagement
-
High traffic does not guarantee profitability
-
Product data reveals customer preferences
Practical Questions (From the Image)
-
What is the total revenue in the selected period?
-
Which products are purchased most often?
-
Is revenue growing steadily or fluctuating?
Retention overview
this is monitoring retention, i.e. how often users return to our website or app after their first visit. Based on this, we can measure their loyalty and how engaged they are. We use the report to divide users into those with high and low retention, identify areas where we have problems, and segment users by source, demographics, or behavior. It is also important to optimize the user experience and test strategies to improve retention value. (Medium.com, 2024)
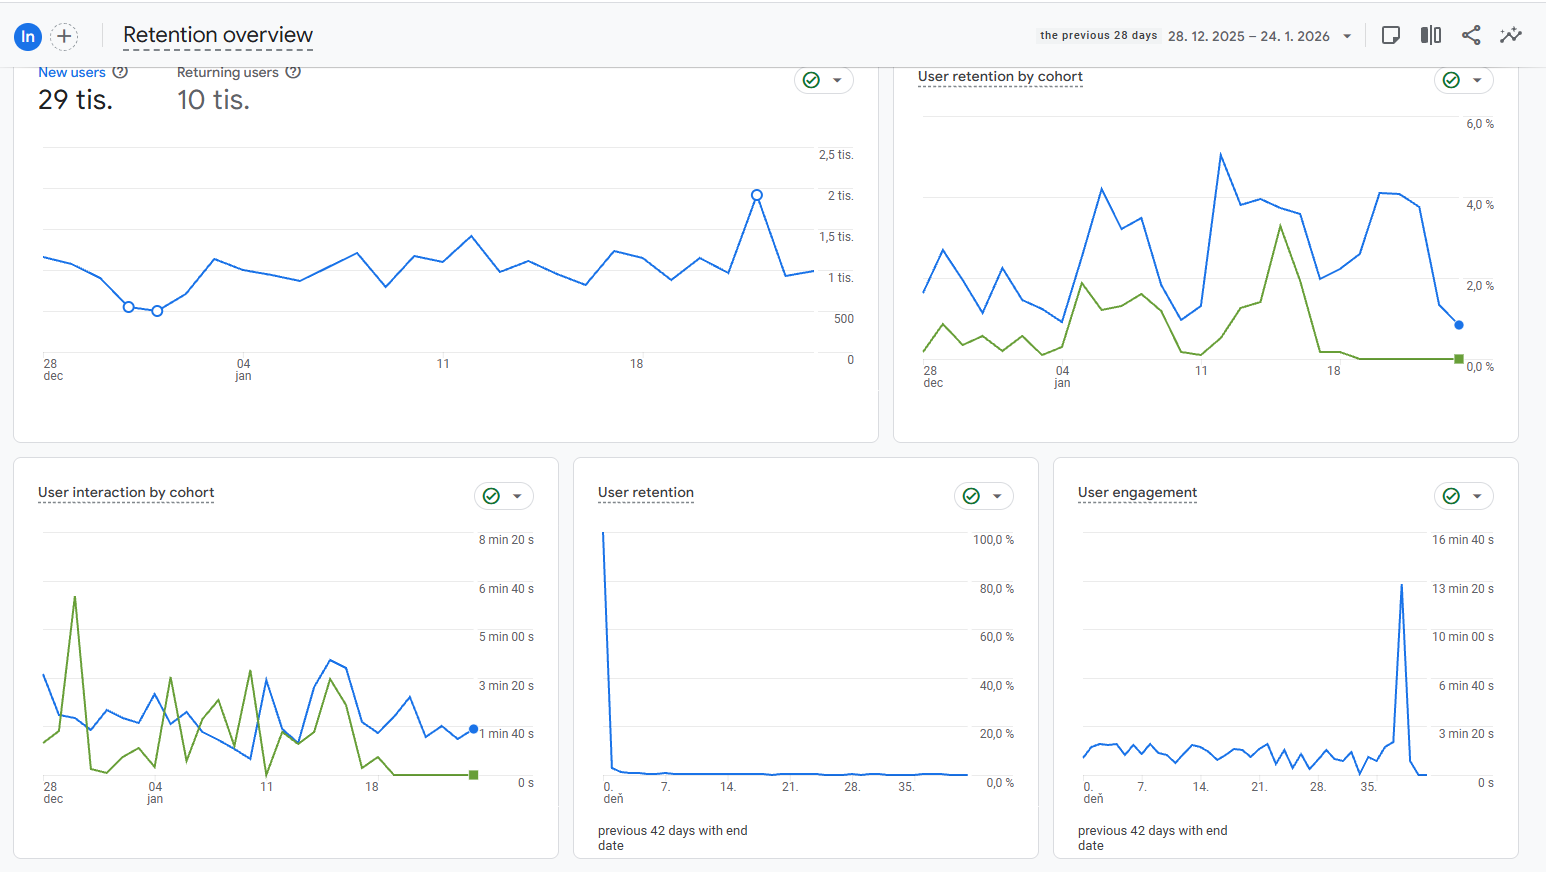
Observe:
-
difference between new and returning users,
-
how quickly users drop off,
-
engagement trends over time.
Key Insights (Highlights)
-
Retention is cheaper than acquisition
-
Low retention often signals UX or value problems
-
Loyal users usually generate higher lifetime value
Practical Questions (From the Image)
-
Is retention improving or declining over time?
-
How strong is the return rate after the first visit?
-
What strategies could improve retention?
By completing this activity, you have learned how to navigate GA4 reports as a connected system rather than isolated dashboards, enabling you to interpret user behavior across the entire customer lifecycle. These reporting skills form the foundation for data-driven decision-making in marketing, UX, and business strategy.