Advanced printing options
Drawing sheet - Layout
The separate drawing sheet - Layout (Fig. 113) represents a single sheet of paper with multiple settings (drawing size and orientation, print styles, printed objects, etc.). One file can have a maximum of 255 layouts, the setting each one can be independent of the others. This makes it possible to create layouts in different dimensions, orientations printed on different printers and the like. It should be noted that the layout (also known as the paper space) and the model space are two different spaces; while it is possible to enter and to display the model space from the layout using the viewport. The viewport is a window that is used to look at the objects placed in the model space from the layout space. In general, the model space is an infinitely large three-dimensional space in which a starting point is defined (a point with zero coordinates in the direction of the axes x, y, z) and in which individual objects can usually be found in their real dimensions in the selected units.
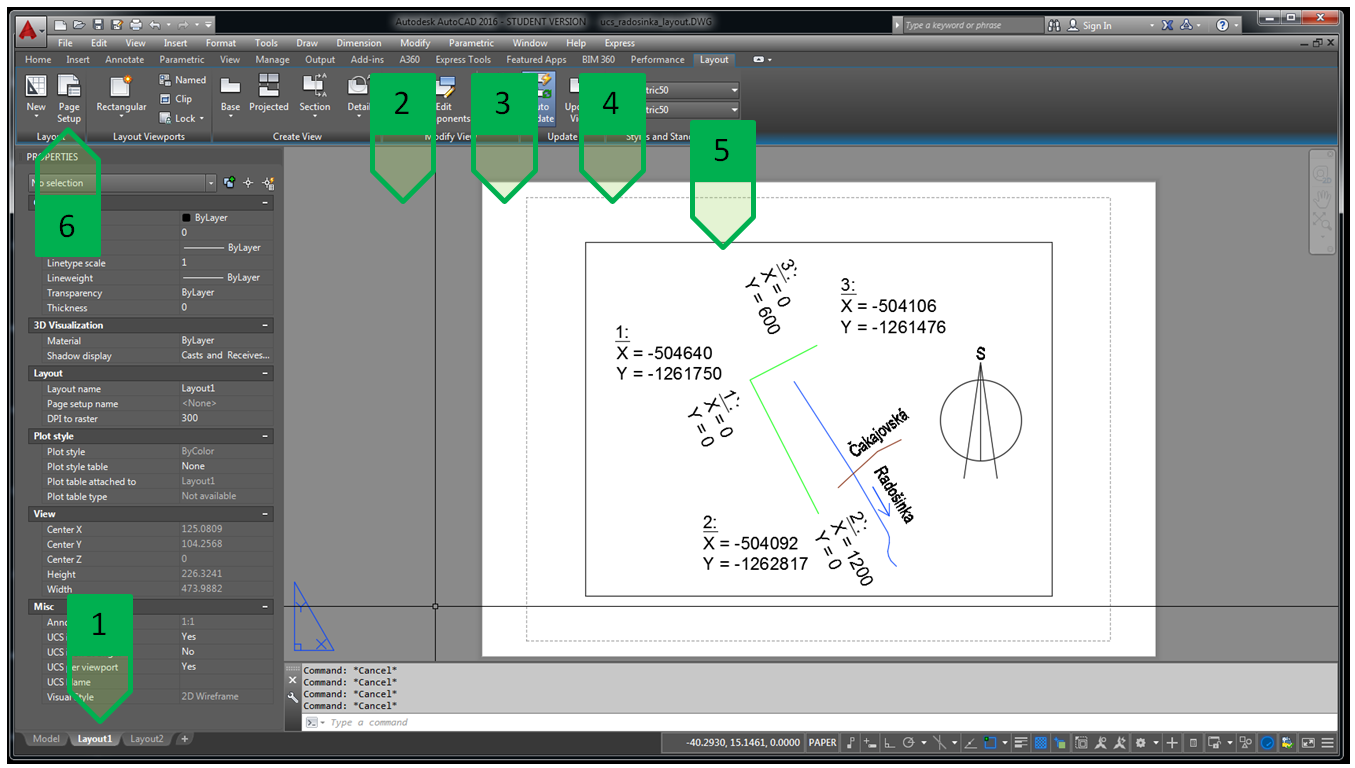
Fig. 113: Layout - separate drawing sheet, 1 - layout tab; 2 - area outside the drawing; 3 - drawing area out of printing range; 4 - limit of the printing range; 5 - viewport boundary; 6 - button for layout editing on the “Layout” tab
Each layout has a tab (Fig. 113 – 1) that serves to open the required layout. The grey area (Fig. 113 – 2) is a part outside the drawing itself (Fig. 113 – 3) - the dimensions and orientation of the drawing are given by the layout settings. The drawing has a default printable area(Fig. 113 – 4), with the beginning of the layout coordinate system (point 0.0) which is the lower left corner of the printable area. The objects outside this area will not be printed. In the layout, viewports can be inserted - they are cut-outs that show part of the model space in the required location in the required zoom (Fig. 113 – 5). The outline of the viewport cannot be turned off and will be printed in a setting where the layer in which it is created has been set. If the outline of the viewport is not required to be displayed, it must be placed in a layer that has the offset print parameter turned off (Fig. 62 - 15).
The layout parameters determine its setting which can be modified as required. The editing of the layout settings can be done either by clicking the required tab and choosing the “Page setup manager” option or by using the icon on the “Layout” tab (Fig. 113 – 6).
The layout setting (Fig. 114) is the same as the standard window with print settings.
When creating outputs, the software offers the use of the installed printers (Fig. 114 -1) as well as a series of custom printers that can be used. We can mention mainly “DWG to PDF” and “AutoCAD PDF” for the creation of the *.pdf files and “Publish to Web” for the creation of outputs in the *.jpg or *.png raster format.
The size, or the format of the paper in the printers (Fig. 114 - 2) may vary depending on the selected printer. To create a custom paper format, this function can be found in the printer properties.
The print area (Fig. 114 - 3) of the layout can be set as for normal printing - to the displayed part, window, limits, and range, but it also allows the “Layout” setting which can be used to print the drawing or the layout as it is currently set, i.e. it prints the range of the printable area given for the used paper format. The offset of the printed region (Fig. 114 - 4) determines the offset of the beginning of the layout coordinate system from the lower left corner of the printable area.
The assignment of the print styles (Fig. 114 - 5) determines the use of the tables of the object properties assignment (colour, thickness, line type, etc.) for the given layout. Each layout in the drawing can have a different table of print styles selected.
The setting of the print quality and print styles (Fig. 114 - 6) determines the quality at which the layout is printed. In contrast to the print settings, from the model space it is not possible to set the display style for the layout - this must be set separately for each viewport.
The print settings (Fig. 114 - 7) allow to turn on or off the options of the printing for the line thickness, transparency, printing with the print styles, to print the whole area of the paper, or to hide the objects in the area of the paper.
The orientation of the drawing (Fig. 114 - 8) allows to adjust the orientation of the paper horizontally or vertically. This option allows rotating the paper if the selected printer has no pre-defined paper format, especially for the horizontal and vertical orientation, or when it is necessary to keep the edges defined by the paper format, but the orientation should be different from that specified by the format.
The preview of the layout with the current settings (Fig. 114 - 9) allows to browse the drawing with the currently set parameters before printing. The total scale of the layout printing (Fig. 114 - 10) when printing from the layout is set to 1:1 by default, so all the objects - viewports as well as the other objects inserted directly into the paper space of the layout will be displayed as set for the given layout.
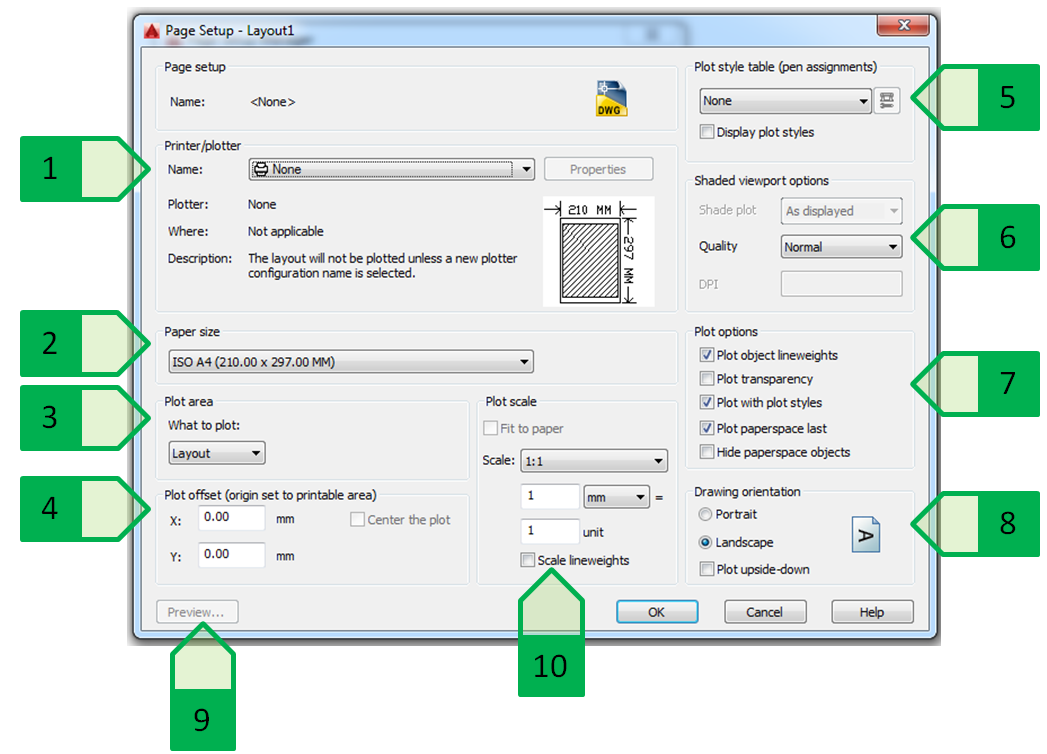
Fig. 114: Layout parameters. 1 - printer selection; 2 - paper format; 3 - printing area; 4 - offset of the printed area; 5 - table of the print styles; 6 - setting of the display styles and print quality; 7 - options of layout print settings; 8 - drawing orientation; 9 - preview of the layout with the current settings; 10 - total scale of the layout printing.
Using the viewports
The options of layout creation or the function of the viewports will be demonstrated in an example of the situation of the pumping station at the Radošinka stream, where the room of the warehouse control centre has been added.(Fig. 115). The goal will be to create an A3 drawing, where, in the scale of 1: 200, the whole object of the pumping station will be displays, as well as the detailed floor plan of the control centre in the scale of 1:50. The equipment and description with the dimensions of the control centre created in its own layers, which will allow controlling the display of these elements depending on the floor plan in question (the overall floor plan of the station or the detailed floor plan of the control centre).
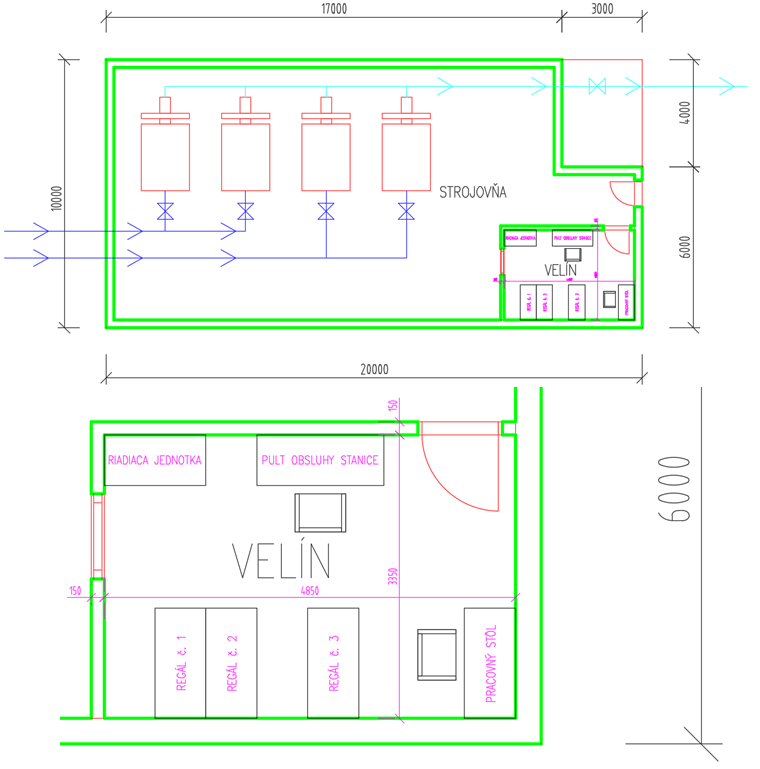
Fig. 115: Overall floor plan of the pumping station (at the top) and detailed floor plan of the control centre (at the bottom)
The first step is to set the page. We use the “page setup manager” tool for “layout1” to set the following parameters:
- Printer “DWG to PDF”
- Paper format ISO A3 (420.00 x 297.00 MM),
- print area: Layout,
- offset of the printed area: 0.00 for both axes,
- assignment of the print styles: “monochrome.ctb” (only for black printing),
- drawing orientation: Landscape (width),
- total scale of the layout printing: 1:1.
These settings will immediately appear on the selected layout (Fig. 116).
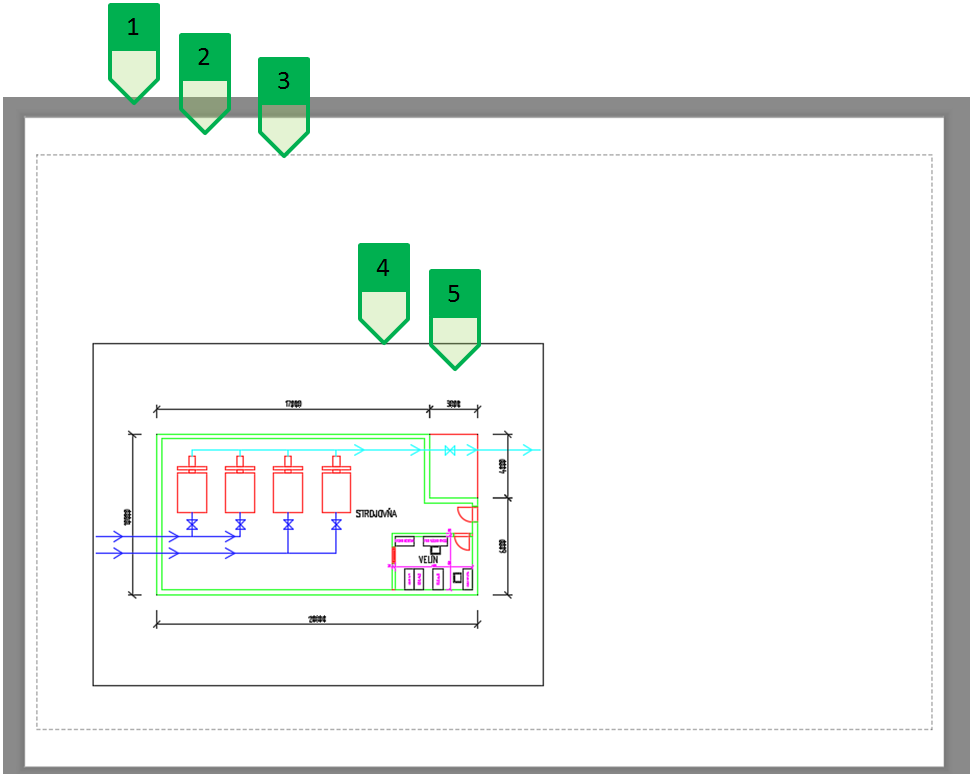
Fig. 116: Layout of the floor plan drawing for the pumping station, 1- area outside the selected drawing format A3; 2 - drawing of A3 format (area outside the printable area defined by formatting for the selected printer); 3 - border of the printable area; 4 - viewport frame; 5 - part of the model space displayed in the given viewport
The viewport can be edited to the desired shape, or size by its marking and the displacement of its top points. From the layout space, it is possible to enter the model space in two ways:
- by double-clicking the inner part of the viewport,
- by marking the required viewport and by clicking the switch “PAPER” or “MODEL” in the status line (Fig. 117 - 4).
Upon entering the model space, the viewport frame changes its thickness, and the cross line of the cursor does not extend beyond the viewport frame. Then it is no longer possible to manipulate the objects in the layout, only the objects in the model space. Also, the control of the displaying - zooming in/out and scrolling is applied to the model space until the display of the particular viewport is locked. The coordinates displayed in the status line show the current position of the cursor in the model space (Fig. 117).
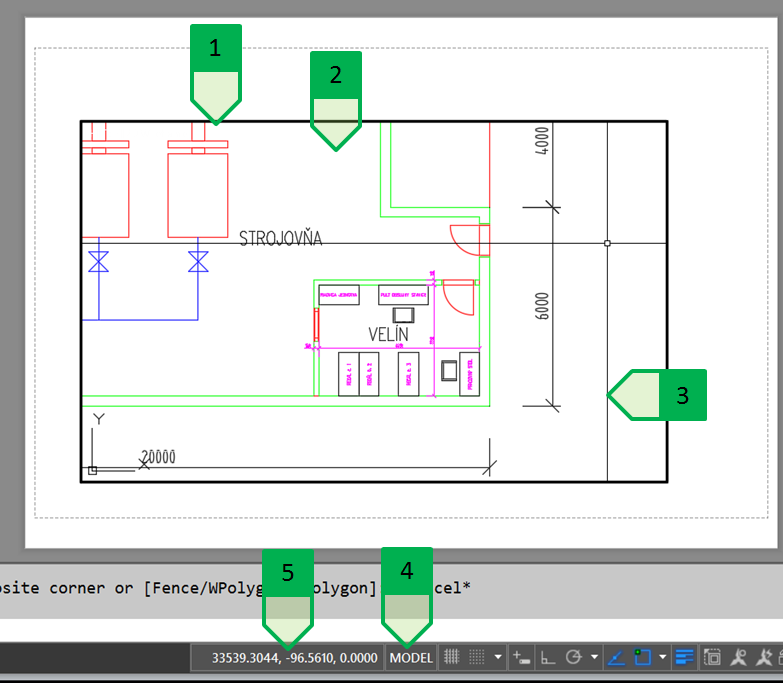
Fig. 117: Entry into the model space through the viewport, 1 - changed thickness of the viewport frame indicating entry into the model space; 2 - model space in which the display has changed - zooming in on the part of the control centre; 3 - cross line (not exceeding the viewport frame); 4 - switch for switching between the model space and the paper; 5 - coordinates showing the cursor position in the model space
The leaving of the model space in the viewport is similar to the entry into this space:
- by double-clicking outside the area of the viewport,
- by clicking the switch “PAPER” or “MODEL” in the status line (Fig. 117 - 4).
The setting of the view scale of the viewport (Fig. 118) on the drawing prepared in the same units as the units of the paper format can be performed in two ways:
- by using the command “ZOOM” via the command line inside the viewport and entering the desired scale in the format “1/MMMxp” , where MMM is the scaling number - for the scale 1:50 the entered value is “1/50xp”,
- by marking the viewport frame and setting it on the property palette - either by selecting the scale in the pre-defined scale list or by entering the custom scale in the “Custom scale” field in the format 1/MMM format where MMM is the scaling number - for the scale 1:50 it is the value of 1/50 or its decimal format of 0.02 calculated as 1:50.
In both cases, the “Custom scale” value will always be displayed as a decimal format. In general, the use of the fraction in the “Custom scale” is more suitable as there is no rounding, for example when selecting the scale of 1:75.
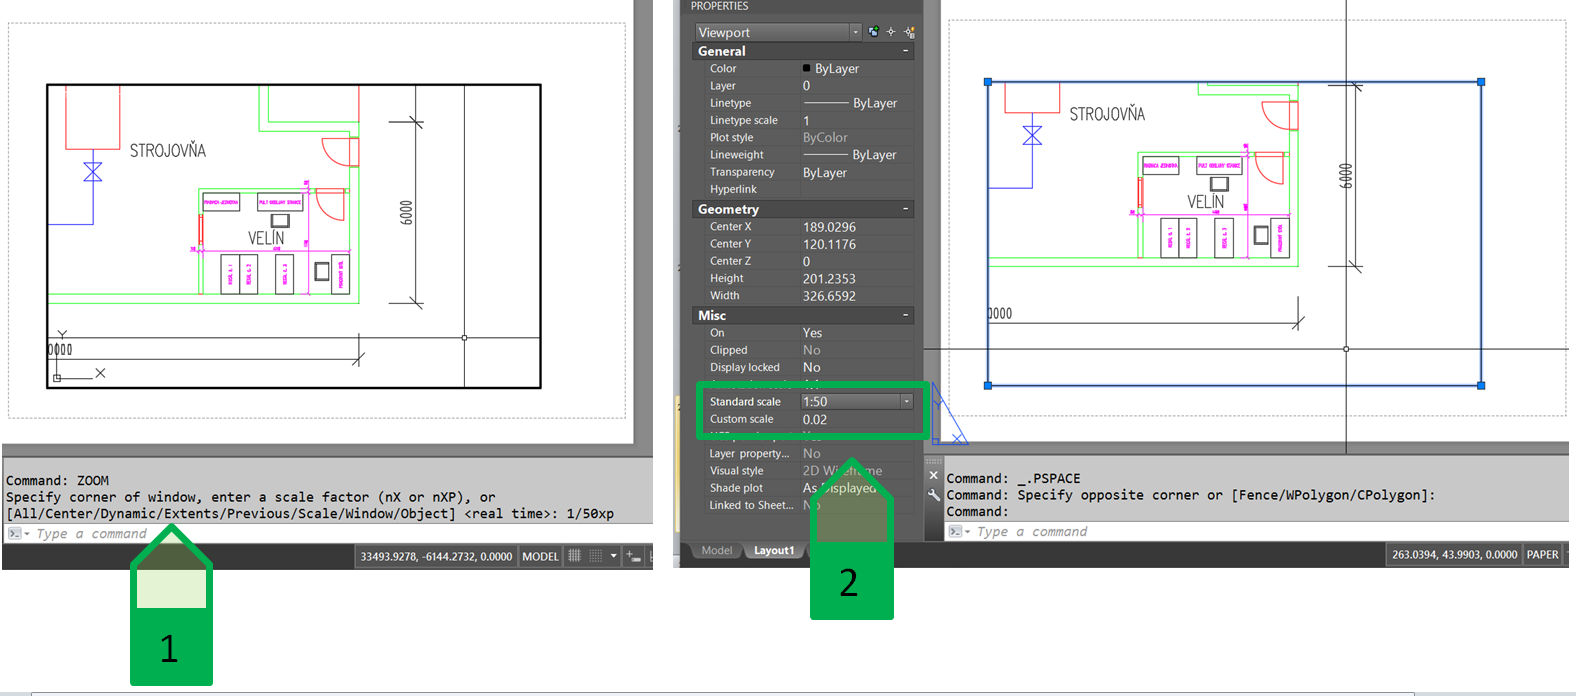
Fig. 118: Setting the viewport scale. On the left - setting from the inside of the viewport; 2 - setting from the paper area through the properties palette. 1 - entering the scale using the command “ZOOM”; 2 - setting the scale in the “Standard scale” or “Custom scale” fields.
After setting the correct scale, it is advisable to lock the viewport display to prevent the unwanted scale changes, for example, by zooming in or moving the display inside the viewport using the middle button of the mouse. In the locked viewport, the zooming in/out or moving the display applies to the entire layout, not only to model space displayed in the current viewport. The locking as well as unlocking of the viewport can be performed in two ways (Fig. 119):
- using the button in the status line,
- setting in the properties palette.
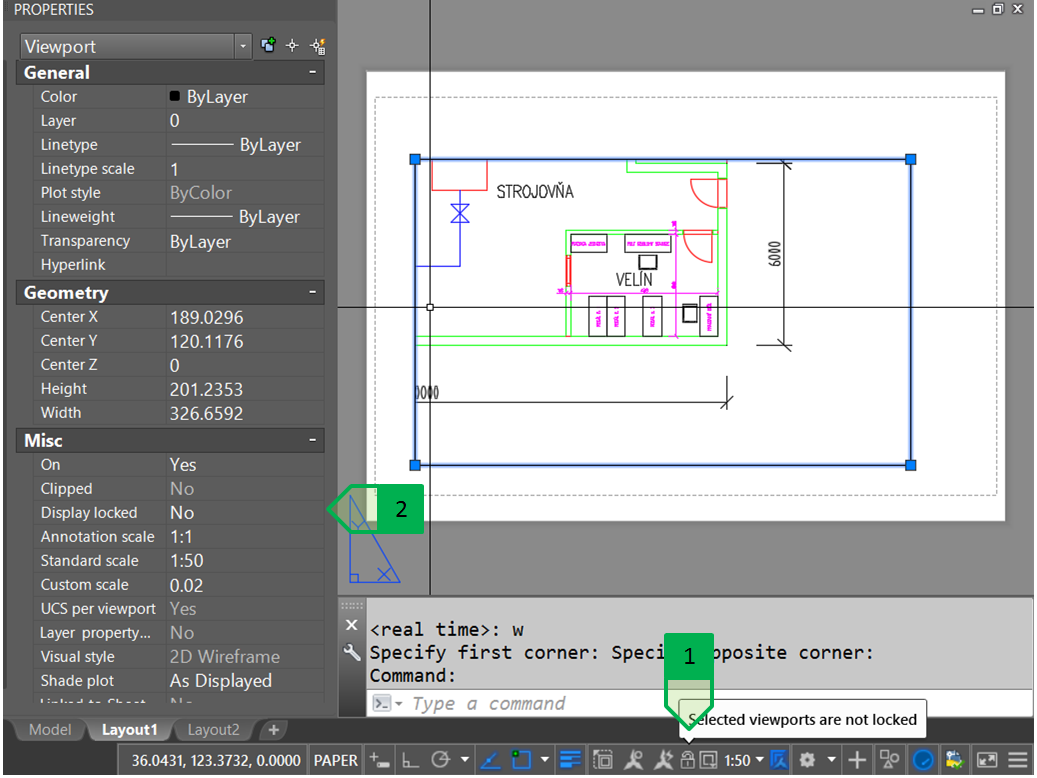
Fig. 119: Locking the viewport, 1 - using the button in the status line; 2 - using the properties palette
There may be a maximum of 64 active viewports in one layout. The new viewport can be created either as a copy of the existing viewport or by inserting a new viewport using the “Layout” tab and by selecting on the “Layout Viewports” panel (Fig. 120).
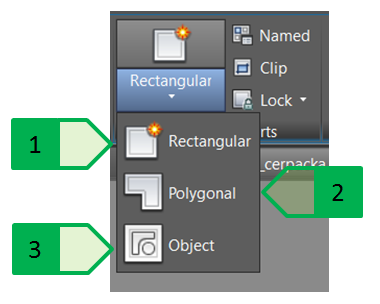
Fig. 120: Inserting a new viewport, 1 - square; 2 - polyline; 3 - using the existing object in the layout
In addition to the viewports, it is possible to insert the design of other objects into the layout itself and to move or change it arbitrarily. In case of the pumping station at Radošinka stream, the headings of the individual floor plans, the corner listing, the tables of the equipment and the notes to the drawings were added to the two viewports.
Layers and viewports
For the individual viewports, the modification of the layer properties is necessary for the correct displaying or turning off the displaying of the required objects. In case of an overall floor plan, it is necessary to turn off the description of the control centre as well as the equipment, while in the floor plan of the detail of the control centre, these objects have to be displayed, therefore we cannot use the total freezing or turning off the layer. For this purpose, it is advisable to use the freeze option in the current viewport that is displayed after entering the viewport in the scrolling list of layers as well as on the palette of the layer properties (Fig. 121).
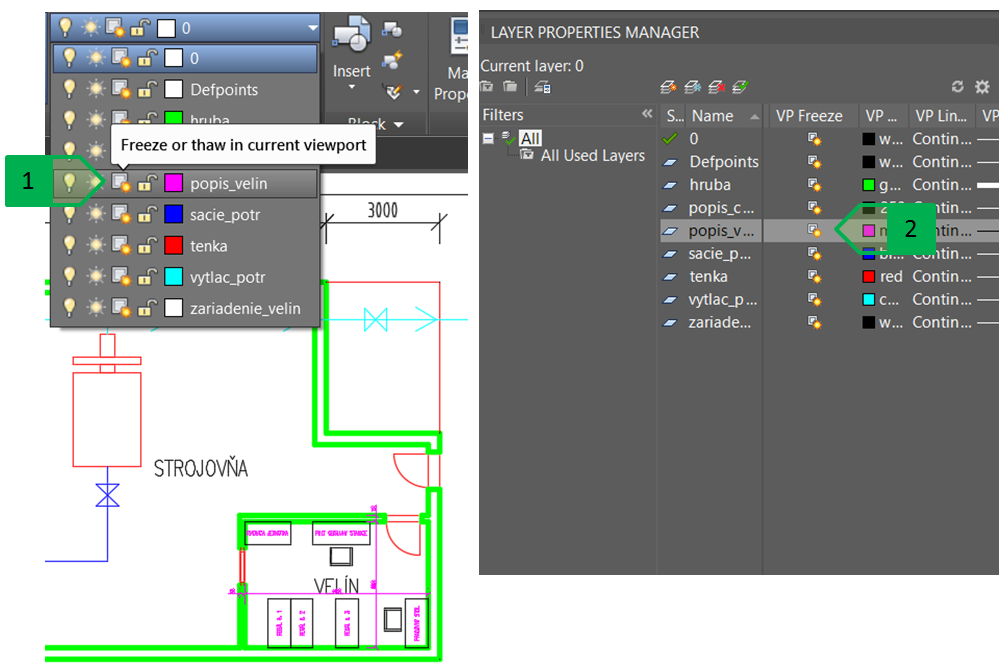
Fig. 121: Freezing or unfreezing the layer in the active viewport, 1 - setting by using the layers list on the “View” tab on the “Layers” panel; 2 - setting by using the palette of the layer properties
By freezing the layer of the description of the control centre, the layer of the items in the viewport of the pumping station floor plan as well as the freezing of the layer of the overall description in the viewport of the detailed floor plan of the control centre, we achieve the required content of the particular viewports. Since the freezing of the layer of the description of the control centre was performed only for the particular viewport, the names of the floor plans created in that layer, but inserted directly into the layout, will be the headings displayed in the layout (Fig. 122).
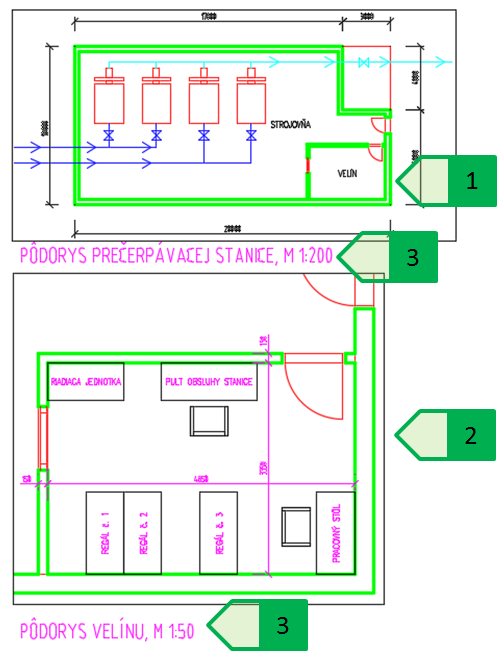
Fig. 122: Freezing the layer in the selected viewport, 1 - floor plan without the display of the description of the control centre and the equipment; 2 - detail of the control centre with the displayed description and the equipment and the turned-off overall description (missing heading “VELÍN” visible in the overall floor plan inside the object of the control centre); 3 - headings of the floor plans displayed despite the fact that this layer is frozen in one of the viewports
If the viewport frame is not to be displayed after printing, the viewport must be moved to a layer that is not printed.
The resulting drawings of the pumping station floor plan with a detailed floored plan of the control centre can then be printed to create a PDF file (Fig. 123), displaying the individual objects according to their setting, and the colour of all the objects that are printable will be black because the layout was assigned the “monochrome.ctb” print style.
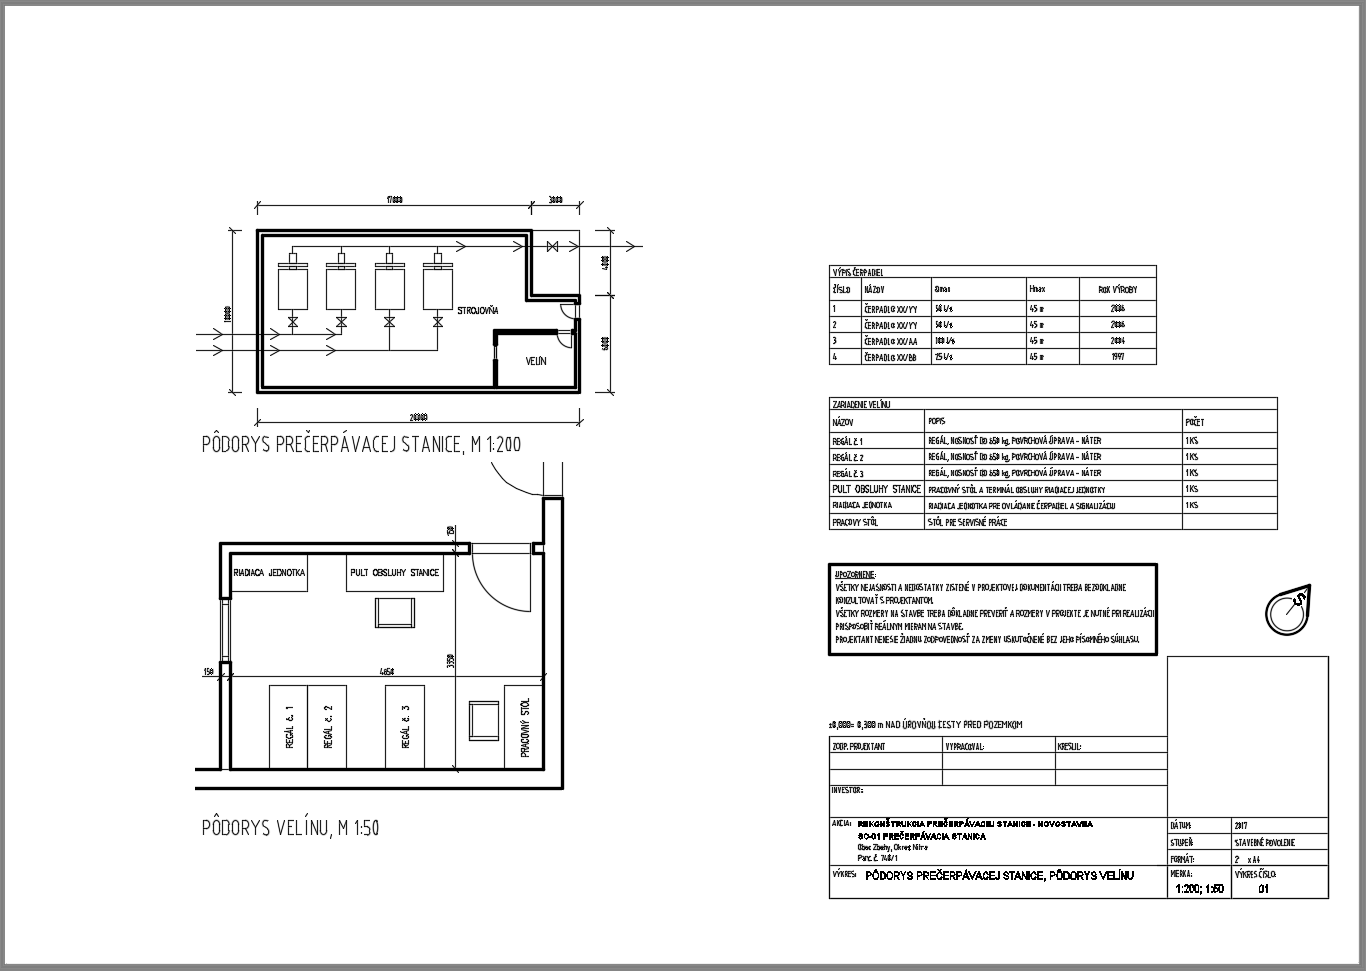
Fig. 123: Resulting drawing of the pumping station
Scale of the drawing viewport with various units and the coordinate systems of the viewports
In case of drawings prepared in meters and using the paper format in millimetres, the setting of the viewport scale is slightly different. This case will be demonstrated in the drawing of the schematic situation of the Radošinka stream at the site of the road bridge to the village of Čakajovce, which is prepared in S-JTSK and therefore the units of the model space are meters. The required content will be printed on and A3 drawing in a scale of 1:5,000, the display will be rotated according to the new coordinate system created by the procedure described in chapter “Creating a new coordinate system”. At the same time, a viewport will be inserted into the drawing, with the display of a clear situation in a scale of 1: 20,000 oriented according to S-JTSK.
Two viewports will be used:
- the viewport of the detailed situation in a scale of 1: 5,000 with a rotated coordinate system,
- the viewport of broader relations oriented according to S-JTSK in a scale of 1: 20,000.
For the viewport of the wider relations , the UCS “World” will remain as the current coordinate system. The scale for drawings prepared in units other than millimetres is simply entered as “Custom scale” into the property field of the viewport according to the formula XXX/MMMxp. XXX means the conversion from the units of the model space to millimetres - from meters to millimetre this value is 1,000 (1 m = 1,000 mm). MMM means the scaling number. In case of a wider situation for the scale 1:20,000, the entered value is “1,000/20,000xp”. The viewport set like this can then be locked.
For the viewport of the detailed situation, first the rotated coordinate system is selected as the current one, and then the scale is set based on the same principle as for the wider situation, and the scale is 1,000/5,000xp.
The drawing (Fig. 124) prepared in this way can be supplemented by the required notes, the layer settings can be edited, etc.
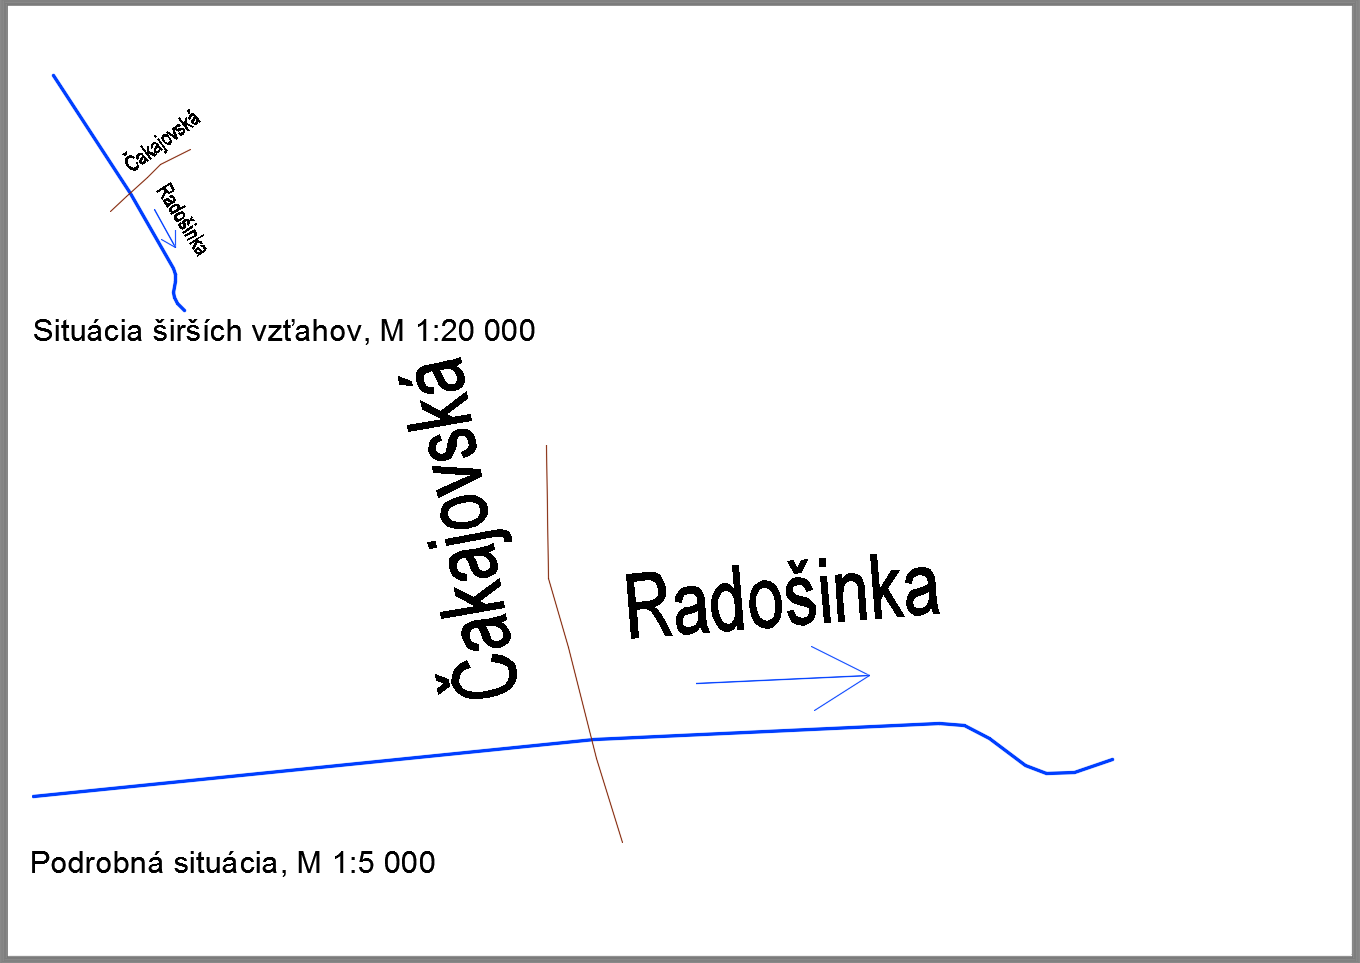
Fig. 124: Situation drawing of the Radošinka stream